doi: 10.56294/hl2022146
ORIGINAL
Analyzing the Influence of Health-Related Factors on Quality of Life among Elderly Populations
Análisis de la influencia de los factores relacionados con la salud en la calidad de vida de las personas mayores
J.Bikrant Kumar Prusty1
![]() , Adarsh Kumar2
, Adarsh Kumar2
![]() , Pooja Varma3
, Pooja Varma3
![]() , Rajesh Kedarnath Navandar4
, Rajesh Kedarnath Navandar4
![]()
1IMS and SUM Hospital, Siksha ‘O’ Anusandhan (Deemed to be University), Department of Paediatrics. Bhubaneswar, India.
2Noida International University, School of journalism and Mass Communication (SJMC). Greater Noida, India.
3JAIN (Deemed-to-be University), Department of Psychology. Bangalore, India.
4JSPM Jayawantrao Sawant College of Engineering Hadaspar, Department of Electronic & Telecommunication Engineering. Pune, India.
Cite as: Prusty JK, Kumar A, Varma P, Rajesh KN. Analyzing the Influence of Health-Related Factors on Quality of Life among Elderly Populations. Health Leadership and Quality of Life. 2022; 1:146. https://doi.org/10.56294/hl2022146
Submitted: 17-08-2022 Revised: 04-11-2022 Accepted: 18-12-2022 Published: 19-12-2022
Editor:
PhD.
Prof. Neela Satheesh ![]()
ABSTRACT
The impact of health-related issues on elder individuals’ quality of life (QoL) is examined, and understanding the factors influencing older people’s well-being is crucial as the world’s population ages. Research looks at social, mental, and physical health indicators and how it affect various aspects of QoL, such as social interaction, emotional stability, and physical functioning. Standardized health evaluations and structured interviews were used to gather information from a sample of 850 senior citizens. The data include chronic illnesses, mobility issues, cognitive decline, physical health, and mental health conditions (anxiety and depression), which are important health-related considerations taken into account. Community involvement and social support systems were also assessed in connection with QoL. The IBM SPSS software version of 30 was utilized. The descriptive statistics were implemented to connect the participant characteristics, multiple regression analysis was employed to ascertain the fostering power of health-related factors on QoL, and multivariate analysis of variance (MANOVA) was utilized to estimate the overall effect of health-related factors on several QoL dimensions. The findings show that whereas cognitive impairments are substantially associated with decreased social engagement and overall life satisfaction, health issues and mobility limits considerably impact physical and emotional well-being. To improve elder people’s QoL, these findings highlight the necessity of comprehensive healthcare strategies that address social, emotional, and physical well-being. Further research should explore interventions aimed at minimizing the impact of health-related factors on QoL in elderly populations.
Keywords: Quality of life (QoL); Elderly Populations; Multivariate Analysis of Variance (MANOVA); Physical and Mental Health; Multiple regression Analysis.
RESUMEN
Se examina el impacto de las cuestiones relacionadas con la salud en la calidad de vida (CdV) de las personas mayores, y comprender los factores que influyen en su bienestar es crucial a medida que envejece la población mundial. La investigación examina los indicadores de salud social, mental y física y cómo afectan a diversos aspectos de la CdV, como la interacción social, la estabilidad emocional y el funcionamiento físico. Se utilizaron evaluaciones de salud estandarizadas y entrevistas estructuradas para recabar información de una muestra de 850 personas mayores. Los datos incluyen enfermedades crónicas, problemas de movilidad, deterioro cognitivo, salud física y trastornos mentales (ansiedad y depresión), que son consideraciones importantes que se tienen en cuenta en relación con la salud. También se evaluaron la participación en la comunidad y los sistemas de apoyo social en relación con la calidad de vida. Se utilizó la versión 30 del software IBM SPSS. Se aplicó la estadística descriptiva para relacionar las características de los participantes, se empleó el análisis de regresión múltiple para determinar el poder de fomento de los factores relacionados con la salud sobre la CdV, y se utilizó el análisis multivariante de la varianza (MANOVA) para estimar el efecto global de los factores relacionados con la salud sobre varias dimensiones de la CdV. Los resultados muestran que, mientras que las deficiencias cognitivas se asocian sustancialmente con un menor compromiso social y satisfacción vital general, los problemas de salud y las limitaciones de movilidad afectan considerablemente al bienestar físico y emocional. Para mejorar la calidad de vida de las personas mayores, estos resultados ponen de relieve la necesidad de estrategias sanitarias integrales que aborden el bienestar social, emocional y físico. Futuras investigaciones deberían explorar intervenciones dirigidas a minimizar el impacto de los factores relacionados con la salud en la CdV de las poblaciones ancianas.
Palabras clave: Calidad de Vida (CdV); Poblaciones Ancianas; Análisis Multivariante de la Varianza (MANOVA); Salud Física y Mental; Análisis de Regresión Múltiple.
INTRODUCTION
Over the past 50 years, the world’s population has significantly changed due to falling birth rates and rising lifespans. Estimated quality of life (QoL) has a direct connection to problems with well-being in both mind and body in elderly individuals.(1) Maintaining quality of life and receiving ongoing treatment is a crucial factor for older adults when considering the prevalence of multiple illnesses separately.(2) The fundamental component of a positive and active life is good health that promotes cerebral information, mental balance, and physical well-being. Maintaining a healthy lifestyle improves connections and improves productivity.(3) A frequent concept in an elder personal evaluation of a medical state, health-associated QoL encompasses an individual’s cognitive, interpersonal, community, and physiological fitness.(4) Several characteristics could affect the pleasant aging of people, specifically the considerations of accessibility, usability, social connectivity, emotional well-being, and security structure.(5) The technological advancements can significantly enhance the elderly’s overall QoL by significantly increasing these individuals’ independence and activities.(6) Improving older individuals’ QoL leads to superior health outcomes and less reliance on the healthcare system, which makes the elders to remain engaged in their communities.(7)
To investigate the variables determining older individuals with intellectual impairment, a method was recommended that was founded on health-related quality of life (HRQoL).(8) The total quantity of 247 people who were sixty years of age and above received an HRQoL assessed with the short-form health survey (SF-12) and eurqol (EQ-5D) inquiries. The employed descriptive and quantitative statistics proved that the principal factors allied with physical as well as mental HRQoL factors were reliance on the actions of everyday life and experienced discomfort and anxiety.
To evaluate the relationship between variables associated with health and the older population’s QoL, a longitudinal investigation with a community emphasis was carried out.(9) The 813 senior citizens evaluated their QoL through the survey instrument of the world health organization quality of life-brief (WHOQOL-Bref). The findings from the analysis of variance (ANOVA) and regression techniques indicated that periodic medical examinations and diabetes were connected to improved standard of existence, whereas long-term medical conditions, orthopedic concerns, and sensory disorders were linked to more severe QoL.
The variables of socioeconomic factors, medical literacy, self-confidence, support from others, health-promoting actions, and HRQoL in elderly people were investigated.(10) Three communal elder well-being centers were employed to consider 240 older persons. Many variables were evaluated using questionnaires that were self-administered, and multiple regression calculations were performed. The findings demonstrated that HRQOL was significantly influenced by the increased number of variables and emphasized the importance of nursing treatments that improve the actions.
The HRQoL determinants of sociodemographic characteristics, impairment causes, complications, rights within society, and domestic abuse were identified for elder individuals.(11) 275 older outpatient treatments were selected from primary health centers to make up the data collection. Using the SF-36 the HRQoL was assessed. Lower HRQoL ratings in both the physical and mental dimensions were significantly predicted by a more powerful functioning interaction index and not requesting aid from the government, as proved by multivariate analysis.
By considering sociodemographic variables, the correlation between QoL measurements and impairment in elderly patients in hospitals was analyzed.(12) The statistics were obtained from 260 inpatients in primary care and their socioeconomic characteristics, clinical evaluation, frailty circumstance, and QOL collected through the SF-12 survey. Approaches including structural equation modeling (SEM) and linear regression with multiple variables were used. The results showed that QoL was negatively influenced by frailty, with elderly people showing lower physical QOL levels than robust others.
Considering institutionalized and residential care, the evaluation was done on HRQoL along with features of elderly individuals.(13) The questions from SF-12 were used for polling a randomly selected group of 1600 people who were sixty years of age or higher. The one-way ANOVA and regression combining multiple linear frameworks were conducted. The findings showed that age, isolation, and persistent illnesses had an important effect on mental as well as physical wellness and that the elderly individuals who obtained public care in institutions had the smallest HRQoL ratings.
The exploration of the influence of persistent illnesses on self-rated wellness and HRQoL in middle-aged, young, and elderly individuals.(14) The evaluation of additional information from 1932 health of aged people’s indicator inquires was done to effectively prove the examinations. The findings of the linear regression analysis, the impact of persistent illnesses on HRQoL and perceived health varied with the category of age. Multiple disorders were consistently correlated with more serious HRQoL and self-rated health, while young adults were additionally affected by specific chronic illnesses.
The examination addressed socioeconomic variables that influence aged people’s psychological strain, self-worth, and Howl.(15) The statistics were obtained by questionnaires using the WHOQOL-BREF scale, the tool named perception of stress, and the optimism to determine in a longitudinal research with 239 aged persons chosen using two-phase clustering and analysed by implementing inferential and descriptive statistics. The results, delivered the increase between the ages of 60 and 64, while self-esteem was maximized between the ages of 70 and 74. The substantial disparities in QoL measurements by educational level and age underscored the relationship between wellness and demographers.
The variables influencing HRQoL among senior citizens who reside in communities were explored. Through personal conversations, a longitudinal investigation of 896 senior citizens was carried out.(16) A structured survey was used to gather data concerning common aging syndromes, persistent illnesses, socioeconomic factors, and HRQOL. By applying binary logistic regression analysis, the parameters correlated with HRQOL were found. Chronic discomfort and poor nutrition were among the geriatric diseases that had a negative relationship with HRQOL and it was strongly correlated with activity level in everyday life activities.
The purpose of the investigation is to identify how different health-related factors impact various aspects of the QoL in elderly populations. Standardized health assessments and structured interviews were employed to gather information from a sample of 850 elder people.
Part 2 focuses on the methodology section, which consists of data gathering, evaluation approach for the selected participants founded on the necessary variables, and the validated SPSS techniques. Part 3 discusses the impactful findings obtained from the analysis techniques and part 4 concentrates on the discussion of all the outcomes. Finally, the conclusion is described in part 5.
METHOD
The examination has been employed in the evaluation to assess the health related to influencing elder people’s QoL, including the information gathering and selection process using interviews. Discovering patterns and relationships between health problems and QoL outcomes in a large population is made achievable by statistical techniques, which analyse connections among characteristics at a particular point in the period. Figure 1 illustrates the overall flow of the examination.

Figure 1. Methodological flow
Data collection
Among the 1200 elderly individuals primarily invited to contribute to the assessment, 920 participants offered a proper reply rate of 76,7 %, while 280 individuals (23,3 %) did not properly respond. Out of 1200 participants only selected 850 participants, 20 (2,2 %) had been removed based on a standardized psychological evaluation for qualification, and 50 (5,4 %) were removed because of inaccurate information. Ultimately, a quantity of 850 individuals (70,8 %) were involved in the final investigation. Table 1 offers the demographic details of the 850 individuals with the necessary parameters.
|
Table 1. Profile of elderly participants |
|||
|
Demographic factors |
Category |
Total quantity (n) |
Percentage (%) |
|
Gender |
Female |
493 |
58,0 |
|
Male |
357 |
42,0 |
|
|
Age |
60–69 |
340 |
40,0 |
|
70-79 |
320 |
37,6 |
|
|
80 and above |
190 |
22,4 |
|
|
Education qualification
|
Absence of formal education |
102 |
12,0 |
|
Eliminatory |
195 |
23,0 |
|
|
Intermediate |
255 |
30,0 |
|
|
Higher education |
298 |
35,0 |
|
|
Status of marital |
Married |
467 |
55,0 |
|
Widowed |
255 |
30,0 |
|
|
Divorced/Separated |
85 |
10,0 |
|
|
Single |
43 |
5,0 |
|
|
Living Conditions |
Autonomously |
383 |
45,0 |
|
With family |
340 |
40,0 |
|
|
Assisted living/elderly care |
127 |
15,0 |
|
|
Medical conditions |
Chronic diseases |
250 |
29,4 |
|
Mobility concerns |
200 |
23,5 |
|
|
Cognitive decline |
150 |
17,6 |
|
|
Mental health conditions |
130 |
15,3 |
|
|
Physical health |
120 |
14,1 |
|
|
Social Assistance |
Strongly |
510 |
60,0 |
|
Weakly |
340 |
40,0 |
|
The above characteristics primarily focus on the diversity of the elderly population in age, marital status, sexual orientation, social support, where they live, education, and health conditions. These characteristics offer more important historical data for the elderly population.
Qualitative approach to evaluation
As mentioned earlier, an aggregate of 850 elderly people were involved in the final assessment constructed on the qualitative approach. Each round consists of a 30-minute duration of qualitative interviews with a total amount of one hour time period with 2 rounds, which was carried out to evaluate the necessary variables impact on the QoL in older individuals.
Evaluation variables
· Chronic illness: a large percentage of senior citizens suffer from severe chronic illnesses. These conditions can be effectively divided into three groups encompassing vulnerability, important and eventually deadly persistent illness, and nonfatal long-term conditions. The common chronic conditions are tumours, organ malfunctions, cartilage damage, vision and hearing issues, and weaknesses of several systems in the body as their inherent resources degrade with age and disease. These play a crucial role in the degree of existence of the elder people.
· Mobility issues: elderly people spend an increasing amount of time in their homes and the neighbourhood due to their aging and no longer meet individuals who live distantly. In the manner, their social circle grows more limited also it creates the loneliness of the individuals, which makes them depressed.
· Cognitive decline: cognitive decline is a developing issue that is frequently unnoticed until official diagnoses are given, which is the rise in age-related neurological conditions including dementia, could affect the likelihood of surviving as well as one’s financial and psychological well-being, challenge an interpersonal dimension and insufficient instructional information that leads to loss of independence and difficulty expressing emotions.
· Physical health: physical well-being is the indicator of older people’s decreased nutritional health, and overweight. Retirement-related reductions in job responsibilities are the cause of the drop in levels of exercise, as is joint and muscle degeneration that makes mobility more challenging and also it is associated with mental wellness, self-perception, and body parts pain.
· Mental health: for older adults, mental health issues are an important contributor to morbidity and early mortality. Syndromal intellectual, emotional, or behavioural problems that represent dysfunction in the psychological, biological, or developmental underpinnings of mental functioning are referred to as mental health disorder that leads to an overall decrease in satisfaction and enjoyment of life.
The diagrammatical representation of the mentioned five variables influence on the older people’s QoL is shown in figure 2.
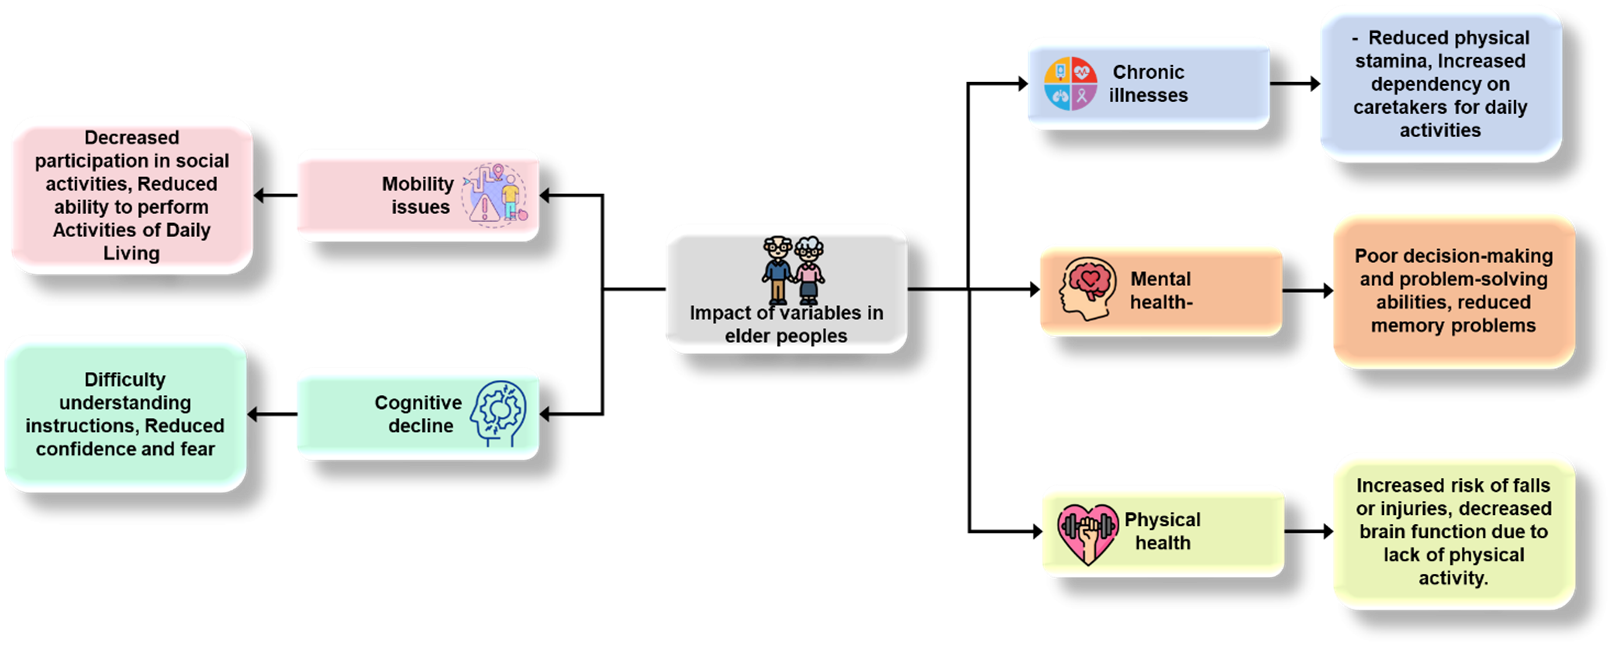
Figure 2. Variables impacts on QoL of elder people
The health challenges faced by the elderly encompass a combination of physical, cognitive, and mental health issues. The existences of older persons are significantly impacted by a variety of factors, including cognitive decline, mobility limitations, chronic diseases, and their effects on mental health. Improving elders’ life expectancy and quality of life requires dealing with these issues through social assistance, preventative care, and easily accessible medical services.
Statistical analysis
The statistical package for social sciences (SPSS) of version 30 was employed for examining all of the outcomes that were acquired. The validation is done through the three analysis techniques namely, multiple regression, descriptive statistics, and MANOVA assessment.
Descriptive statistics
Descriptive statistics is used to analyse and summarize the distinctive characteristics of a collection of elderly people’s data using a variety of quantitative methods. The method uses metrics like mean, median, and other variance to provide comprehensive and easily understandable estimates and findings of the data collection. The outcomes for the demographic characteristics expressed health problems, and QoL have been presented using descriptive statistics. The average amount of every variable in the collection of data is represented by the value of the mean. The level of dispersal or fluctuation is delivered by the factor standard deviation (SD). Greater distributed readings are represented by a larger SD, and stronger aggregation around the mean is demonstrated by a lower SD. Skewness is an indication of the imbalance of the information population. A left skew is denoted by a negative number and a right skew by an integer that is positive. The shape of the statistic distribution is evaluated by kurtosis. A higher quantity of information in the tails than an average distribution is shown by positive kurtosis, whereas fewer is indicated by negative kurtosis.
Multiple regression
A type of statistical technique called multiple regression analysis investigates the association between any number of variables and utilizes the results to determine the dependent variables’ quantities. Equation 1 provides the multiple regression formula.
![]()
Where a is the value for prediction on dependent factors. x1, x2,… xn, are the autonomous variables and y0 denotes the output quantity when all x1, x2,… xn, becomes ideal.
The standard error (SE) denotes the mean inaccurateness in regressive coefficients. More accurate forecasts are represented by a lower deviation from the mean. The strength and direction of the correlation between the reliance factors and the autonomous variable are assessed by standardized coefficients (β) to facilitate the examination. The proportion of the coefficient to the SE is described by t-values. A stronger prediction is indicated by an increased t-value. The possibility that the relationship that has been observed as an outcome of coincidence is offered by p-values. The statistically significant difference is frequently demonstrated by less than 0,05. The term constant defines the coefficient at the regression equation’s baseline. It represents the predicted value of the dependent factors when all autonomous characteristics are equal to null. Considering all the other factors that maintained stability, the unstandardized coefficient (B) demonstrates the way the dependent variable that relies on QoL alters as the variable predicted by one unit.
Multivariate analysis of variance (MANOVA)
Followed by regression analysis, the examination of variability for multiple variables that are influenced by a combination of factors is provided by the MANOVA technique. Equation 2 gives the numerical formula for the analysis.
![]()
Where the covariance matrix is described by ∑.
The measurement statistic utilized in the MANOVA assessment is represented by the f-value. It balances the variability in the health factors. Higher f-values recommend the variances across groups tend to be more significant. A testing statistic called wilks’ lambda is utilized to evaluate the model’s predictive relevance; it also measures the error (unexplained variance) to the proportion of deviation that can be compensated by independent factors. A higher impact of the autonomous variables on the reliant variable can be detected by lower lambda measurements. The results of statistical importance are established using the p-statistics; generally values below 0,05 indicate that the determinant has a significant effect on the dependent characters. The degree of freedom 1 (DF1) stands for the model’s dimensions of independence while the degree of freedom 2 (DF2) denotes the levels of liberty connected to the error of judgment. Both are necessary factors for the examination.
RESULTS
The descriptive measurement of the key factors is discussed in table 2, which consists of the necessary indicators for the evaluation.
|
Table 2. Descriptive statistics of health variables |
||||
|
Variables |
Mean |
SD |
Kurtosis |
Skewness |
|
Chronic Illnesses |
2,3 |
1,1 |
-0,5 |
0,2 |
|
Mental Health |
2,1 |
1,0 |
-0,4 |
0,3 |
|
Physical Health |
3,2 |
1,2 |
-0,6 |
0,1 |
|
Mobility Issues |
1,4 |
0,9 |
-0,2 |
0,7 |
|
Cognitive Decline |
1,2 |
0,8 |
-0,3 |
0,5 |
With a mean score of 2,3, chronic illnesses have a more favourable median rating than the other categories. The cognitive decline had the decreased SD (0,8) prove the smallest responsive heterogeneity, implying that a majority of results are concentrated around the median. In contrast to a typical distribution, all variables display negative kurtosis, which suggests that the probabilities are not as inclined to encompass extreme outcomes. The greatest skewness (0,7) is observed in mobility issues, demonstrating a significant right skew with fewer high values. Physical health is the most uniform distribution, with the lowest skewness (0,1). Figure 3 demonstrates the SD and mean value comparison of the variables.
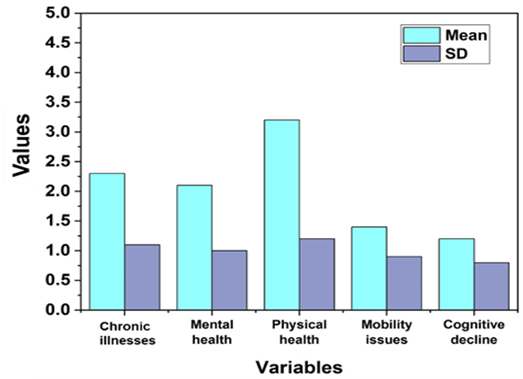
Figure 3. Mean and SD of the descriptive statistics
From the graph, it was concluded that physical health has the superior mean and cognitive decline has the decreased inaccurate in elder people.
Table 3 demonstrates the findings of the regression analysis, which concludes the necessary key indicators for the evaluation of the variables.
|
Table 3. Variables outcomes in multiple regression analysis |
|||||
|
Variables |
SE |
B |
β |
p-statistics |
t-measure |
|
Constant |
0,80 |
4,50 |
- |
<0,001 |
5,625 |
|
Chronic Illnesses |
0,12 |
-0,32 |
-0,18 |
0,008 |
2,667 |
|
Mental Health |
0,15 |
-0,56 |
-0,21 |
<0,001 |
-3,733 |
|
Physical Health |
0,10 |
0,65 |
-0,32 |
<0,001 |
6,500 |
|
Mobility Issues |
0,14 |
-0,45 |
-0,23 |
0,002 |
-3,214 |
|
Cognitive Decline |
0,15 |
-0,78 |
-0,27 |
<0,001 |
-4,333 |
Physical health has reinforced its substantial impact on the dependent variables, as demonstrated by the highest t-value of 6,500. The superior p-statistics (0,008) suggests that chronic illnesses are the least statistically important of the indicators, even if every other variable has significance (p < 0,05). The greatest absolute β value of -0,32, physical health proved the stronger effects. The constant had a 4,50 (B), showing its noteworthy contributions to the regression framework as an ensemble. The lower level of inaccuracies is achieved by the SE (0,15) cognitive decline factor, which is effective for the error-free analysis. Table 4 determines the MANOVA examination for the medical variables that significantly impact QoL across the various dimensions. Figure 4 represents the standard error visualization of every variable in regression analysis.
Figure 4. Variable’s standard error in multiple regression assessment
|
Table 4. MANOVA outcomes of the health factors on QoL |
|||||
|
Determinants |
f-value |
DF1 |
DF2 |
Wilks' lambda |
p-value |
|
Chronic Illnesses |
12,32 |
4 |
865 |
0,85 |
<0,001 |
|
Mental Health |
10,94 |
0,82 |
|||
|
Physical health |
21,11 |
0,75 |
|||
|
Mobility Issues |
15,45 |
0,80 |
|||
|
Cognitive decline |
18,62 |
0,78 |
|||
|
Interaction Effects |
5,74 |
16 |
838 |
0,92 |
|
The f-measurement of 12,32 for chronic diseases indicates a substantial correlation between the dependent variable under investigation and chronic illnesses. Wilks’ lambda for chronic illnesses is 0,85. DF1 = 4 indicates that all the variables are being compared in the part of the model. Every variable has a very strong significant association, as indicated by the p-value of less than 0,001. Figure 5 demonstrates the visual representation of Wilks’ lambda of each variable.
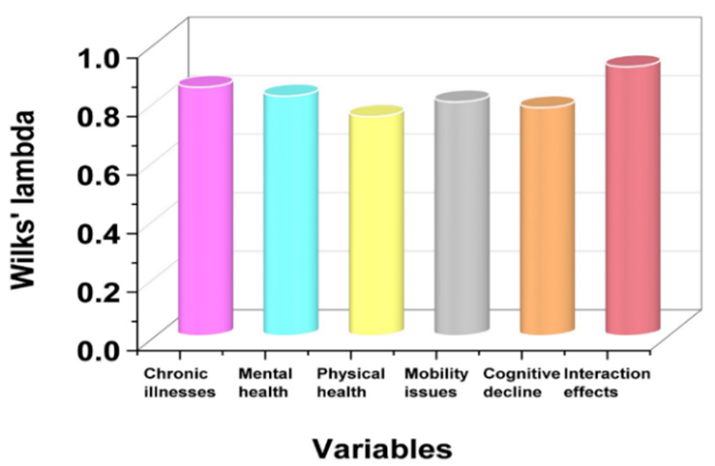
Figure 5. Outcome of MANOVA
DISCUSSION
The significant relationships between health factors and QoL in elder people had been demonstrated by the descriptive statistics. With the mean values and modest skewness and kurtosis values, descriptive framework findings guaranteed the variation across problems with mobility, mental wellness, one’s physical well-being, long-term conditions, and cognitive impairment, indicating an essentially standardized distribution. Physical health was the greatest positive predictor of QoL regarding multiple regression analysis outcomes, although issues with mobility and cognitive decline have been linked to significant negative effects. Persistent medical issues and emotional wellbeing also negatively impacted the level of living, but to a lesser extent. All health variables strongly contributed to QoL variation, founded on the solutions obtained from MANOVA, with the most significant impacts being shown in physical health and cognitive decline. The complicated interconnections across parameters have been emphasized by the effects of interaction.
CONCLUSIONS
The substantial impact of health-related factors on the QoL in older people was highlighted in the investigation. Using the data gathered through standardized health evaluations and structured interviews, based on the necessary factors, including chronic diseases, mobility problems, cognitive decline, physical fitness, and mental wellness conditions, were employed for qualitative selection processes that ensured a representative sample of 850 participants. The findings were validated by the statistical analysis using SPSS version thirty, which included descriptive data analysis, MANOVA, and the method of multiple regression. The results showed that difficulties with mobility and cognitive decline significantly decrease social interaction, psychological stability, and functional abilities, whereas physical well-being is an accurate indicator of the level of existence. The necessity for integrated healthcare practices was shown by the effective outcomes, which illustrated the complex effect of numerous variables on QoL metrics.
BIBLIOGRAPHIC REFERENCES
1. Rong J, Chen G, Wang X, Ge Y, Meng N, Xie T, Ding H. Correlation between depressive symptoms and quality of life, and associated factors for depressive symptoms among rural elderly in Anhui, China. Clinical Interventions in Aging. 2019 Nov 4:1901-10. DOI: 10.2147/CIA.S225141
2. Lee E, Cha S, Kim GM. Factors affecting health-related quality of life in multimorbidity. InHealthcare 2021 Mar 16 (Vol. 9, No. 3, p. 334). MDPI. https://doi.org/10.3390/healthcare9030334
3. Lu J, Yu Z, Zhang X, Wu M, Lin S, Zhu Y, Xu Z, You L, Wei F, Tang M, Jin M. Association between social health status and health-related quality of life among community-dwelling elderly in Zhejiang. Health and Quality of Life Outcomes. 2020 Dec;18:1-8. https://doi.org/10.1186/s12955-020-01358-4
4. Zheng E, Xu J, Xu J, Zeng X, Tan WJ, Li J, Zhao M, Liu B, Liu R, Sui M, Zhang Z. Health-related quality of life and its influencing factors for elderly patients with hypertension: evidence from Heilongjiang Province, China. Frontiers in Public Health. 2021 Mar 16;9:654822. https://doi.org/10.3389/fpubh.2021.654822
5. Özsungur F. Gerontechnological factors affecting successful aging of elderly. The Aging Male. 2020 Dec 4;23(5):520-32. THE AGING MALE https://doi.org/10.1080/13685538.2018.1539963
6. Nevado-Peña D, López-Ruiz VR, Alfaro-Navarro JL. Improving quality of life perception with ICT use and technological capacity in Europe. Technological Forecasting and Social Change. 2019 Nov 1;148:119734. https://doi.org/10.1016/j.techfore.2019.119734
7. Belkacem AN, Jamil N, Palmer JA, Ouhbi S, Chen C. Brain-computer interfaces for improving the quality of life of older adults and elderly patients. Frontiers in Neuroscience. 2020 Jun 30;14:692. https://doi.org/10.3389/fnins.2020.00692
8. Christiansen L, Sanmartin Berglund J, Lindberg C, Anderberg P, Skär L. Health‐related quality of life and related factors among a sample of older people with cognitive impairment. Nursing open. 2019 Jul;6(3):849-59. DOI: 10.1002/nop2.265
9. Santhalingam S, Sivagurunathan S, Prathapan S, Kanagasabai S, Kamalarupan L. The association of health-related factors with quality of life among the elderly population in the Jaffna district of Sri Lanka. BMC Public Health. 2021 Dec;21:1-0. https://doi.org/10.1186/s12889-021-10507-3
10. Lee MK, Oh J. Health-related quality of life in older adults: Its association with health literacy, self-efficacy, social support, and health-promoting behavior. Healthcare 2020 Oct 16 (Vol. 8, No. 4, p. 407). MDPI. doi:10.3390/healthcare8040407
11. Janjusevic A, Cirkovic I, Lukic I, Janjusevic V, Jevtic K, Grgurevic A. Predictors of health related‐quality of life among elderly with disabilities. Psychogeriatrics. 2019 Mar;19(2):141-9. doi:10.1111/psyg.12376
12. Li Q, Han B, Chen X. The association between sociodemographic factors, frailty, and health-related quality of life in older inpatients: a cross-sectional study. Quality of Life Research. 2020 Dec;29:3233-41. https://doi.org/10.1007/s11136-020-02559-6
13. Su SW, Wang D. Health-related quality of life and related factors among elderly persons under different aged care models in Guangzhou, China: a cross-sectional study. Quality of Life Research. 2019 May 15;28:1293-303. https://doi.org/10.1007/s11136-019-02107-x
14. Ge L, Ong R, Yap CW, Heng BH. Effects of chronic diseases on health‐related quality of life and self‐rated health among three adult age groups. Nursing & health sciences. 2019 Jun;21(2):214-22. https://doi.org/10.1111/nhs.12585
15. Karki K, Sapkota A, Jajko S, Singh DR. Socio-demographic variables related to self-esteem, psychological stress and health-related quality of life among older adults: A cross-sectional study in Kavrepalanchowk district of Nepal. SAGE Open Medicine. 2021 Nov;9:20503121211056437. https://doi.org/10.1177/20503121211056437
16. Wang Q, Liu X, Zhu M, Pang H, Kang L, Zeng P, Ge N, Qu X, Chen W, Hong X. Factors associated with health‐related quality of life in community‐dwelling elderly people in China. Geriatrics & gerontology international. 2020 May;20(5):422-9. https://doi.org/10.1111/ggi.13895
FINANCING
The authors did not receive financing for the development of this research.
CONFLICT OF INTEREST
The authors declare that there is no conflict of interest.
AUTHORSHIP CONTRIBUTION
Conceptualization: J.Bikrant Kumar Prusty, Adarsh Kumar, Pooja Varma, Rajesh Kedarnath Navandar.
Data curation: J.Bikrant Kumar Prusty, Adarsh Kumar, Pooja Varma, Rajesh Kedarnath Navandar.
Formal analysis: J.Bikrant Kumar Prusty, Adarsh Kumar, Pooja Varma, Rajesh Kedarnath Navandar.
Research: J.Bikrant Kumar Prusty, Adarsh Kumar, Pooja Varma, Rajesh Kedarnath Navandar.
Methodology: J.Bikrant Kumar Prusty, Adarsh Kumar, Pooja Varma, Rajesh Kedarnath Navandar.
Project management: J.Bikrant Kumar Prusty, Adarsh Kumar, Pooja Varma, Rajesh Kedarnath Navandar.
Resources: J.Bikrant Kumar Prusty, Adarsh Kumar, Pooja Varma, Rajesh Kedarnath Navandar.
Software: J.Bikrant Kumar Prusty, Adarsh Kumar, Pooja Varma, Rajesh Kedarnath Navandar.
Supervision: J.Bikrant Kumar Prusty, Adarsh Kumar, Pooja Varma, Rajesh Kedarnath Navandar.
Validation: J.Bikrant Kumar Prusty, Adarsh Kumar, Pooja Varma, Rajesh Kedarnath Navandar.
Display: J.Bikrant Kumar Prusty, Adarsh Kumar, Pooja Varma, Rajesh Kedarnath Navandar.
Drafting - original draft: J.Bikrant Kumar Prusty, Adarsh Kumar, Pooja Varma, Rajesh Kedarnath Navandar.
Writing - proofreading and editing: J.Bikrant Kumar Prusty, Adarsh Kumar, Pooja Varma, Rajesh Kedarnath Navandar.