doi: 10.56294/hl2022121
ORIGINAL
Organizational Performance Indicators and Their Influence on Patient Satisfaction in Healthcare Environments
Indicadores de rendimiento organizativo y su influencia en la satisfacción del paciente en entornos sanitarios
Basudev Biswal1
![]() , Supriya Awasthi2
, Supriya Awasthi2
![]() , Vandana Sharma3
, Vandana Sharma3
![]()
1IMS and SUM Hospital, Siksha ‘O’ Anusandhan (Deemed to be University), Department of Paediatrics. Bhubaneswar, India.
2Noida International University, School of Allied Health Sciences. Greater Noida, India.
3Arya College of Pharmacy. Jaipur, Rajasthan, India.
Cite as: Biswal B, Awasthi S, Sharma V. Organizational Performance Indicators and Their Influence on Patient Satisfaction in Healthcare Environments. Health Leadership and Quality of Life. 2022; 1:121. https://doi.org/10.56294/hl2022121
Submitted: 11-08-2022 Revised: 29-10-2022 Accepted: 14-12-2022 Published: 15-12-2022
Editor:
PhD. Prof. Neela Satheesh ![]()
ABSTRACT
Organizational performance indicators (OPIs) are key measurements used to evaluate the efficiency, effectiveness, and overall success of healthcare (Hc) organizations. These indicators can potentially influence Patient Satisfaction (PS), an important factor in determining healthcare quality. Understanding the link between OPIs and patient satisfaction might help healthcare practitioners improve service delivery. Hence, to evaluate the impact of several OPI on PS in healthcare settings, this research involves a mixed-methods approach. This approach included quantitative analysis through surveys of OPIs and PS, as well as qualitative interviews with healthcare personnel. OPIs such as Personnel Efficiency (PE), Resource Management (RM), Patient Care Quality (PCQ), Patient satisfaction (PS), and Healthcare Service Time (HcST) were assessed. Data were obtained from various healthcare settings, and using SPSS statistical approaches like descriptive statistics, correlation analysis, and multiple regression, the relationship between OPIs and PS was analysed. Research found a substantial positive relationship between specific OPIs and greater levels of PS. The results indicated that Resource Management (RM) had the highest performance, while Personnel Efficiency (PE) showed the lowest, emphasizing key areas for improving patient satisfaction. The analysis identified areas where OPIs may be enhanced to improve patient experiences, such as communication and personalized treatment.
Keywords: Patient Care; Organizational Performance Indicators (Opis); Healthcare; Patient Satisfaction (PS).
RESUMEN
Los indicadores de rendimiento organizativo (IDO) son medidas clave utilizadas para evaluar la eficiencia, la eficacia y el éxito general de las organizaciones sanitarias. Estos indicadores pueden influir potencialmente en la satisfacción del paciente (SP), un factor importante para determinar la calidad de la atención sanitaria. Comprender la relación entre los OPI y la satisfacción del paciente podría ayudar a los profesionales sanitarios a mejorar la prestación de servicios. Por lo tanto, para evaluar el impacto de varios OPI en la SP en entornos sanitarios, esta investigación utiliza un enfoque de métodos mixtos. Este enfoque incluye un análisis cuantitativo a través de encuestas sobre los OPI y la SP, así como entrevistas cualitativas con el personal sanitario. Se evaluaron OPI como la eficiencia del personal (PE), la gestión de recursos (RM), la calidad de la atención al paciente (PCQ), la satisfacción del paciente (PS) y el tiempo de atención sanitaria (HcST). Se obtuvieron datos de diversos entornos sanitarios y se analizó la relación entre los OPI y la PS utilizando métodos estadísticos del SPSS como la estadística descriptiva, el análisis de correlación y la
regresión múltiple. La investigación halló una relación positiva sustancial entre OPI específicos y mayores niveles de PS. Los resultados indicaron que la Gestión de Recursos (GR) presentaba el mayor rendimiento, mientras que la Eficiencia de Personal (EP) mostraba el más bajo, lo que pone de relieve áreas clave para mejorar la satisfacción de los pacientes. El análisis identificó áreas en las que los OPI pueden mejorarse para mejorar las experiencias de los pacientes, como la comunicación y el trato personalizado.
Palabras clave: Atención al Paciente; Indicadores de Rendimiento Organizativo (Opis); Asistencia Sanitaria; Satisfacción del Paciente (SP).
INTRODUCTION
Organizational Performance Indicators (OPIs) are critical tools used to measure the efficiency, effectiveness, and overall success of Healthcare (Hc) organizations. These gauges deliver healthcare organizations with treasured visions into their processes, helping them recognize parts for development and certify optimal presentation.(1) Common OPIs in healthcare contain Personnel Efficiency (PE), Resource Management (RM), patient attention quality, and effective results. By observing these pointers, administrations could set performance standards, address gaps, and improve their service distribution systems. In the medical field, patient fulfilment has arisen as a central extent of quality and presentation.(2) It replicates patients’ opinions of care they accept, with their connections with healthcare personnel, the effectiveness of service conveyance, and the whole experience during their treatment experience. From top to bottom, levels of patient fulfilment are closely linked to healthier clinical results, enhancing customer adherence, and a robust reputation for Hc suppliers. Therefore, considering the influences that impact patient fulfilment is vital for organizations striving to provide exceptional care.(3)
Despite the significance of OPIs, their direct impact on Patient Satisfaction (PS) remains underexplored. Hc organizations concentrate on successful operational and clinical productivity but might supervise how these efforts turn into improved patient experiences. For example, well-organized personnel management and enhanced resource allocation are likely to improve patient maintenance quality, but the extent to which these OPIs affect PS is not always clear.(4) Hence, analysis on estimating the connection between OPIs and PS is crucial. By recognizing exact OPIs that have a substantial impact on patient involvement, Hc specialists could focus on targeted improvements to enhance facility quality. Furthermore, understanding these interactions could offer an actionable vision to enhance resource operation, foster modified treatment methods, and safeguard that patients obtain personalized high-quality care according to their requirements.(5) Ultimately, this investigation aims to highlight the serious role of OPIs in driving patient pleasure and improving Hc outcomes.
Research Objective
The objective was to evaluate the influence of Organizational Performance Indicators (OPIs) on PS in Hc settings, concentrating on features like PE, RM, PCQ, HcST, and PS, aiming to recognize areas for enhancement in service distribution.
Research Organization
Research is deliberated as follows: Section 2 reviews related literature on sustainable healthcare supply chain performance and its indicators. Section 3 summarizes the methodology, detailing data collection, variables, and analytical techniques. Section 4 offers the outcomes, followed by a discussion. Section 5 concludes the research.
Related works
Patient gratification in Hc using the Rodgers technique of concept investigation was examined.(6) It recognized qualities such as supplier approach, technical proficiency, and availability, with requirements like patient characteristics and competition. The results concentrated on analysing compliance and fidelity. The concentration on conceptual exploration should be improved, as it was examined without wider observational data. The possibility and patient happiness were evaluated with virtual rehabilitation during the COVID-19 pandemic. Data collection tools were administered to 205 participants after virtual rehabilitation visits.(7) From top to bottom, fulfilment scores were detected across all metrics, with females providing higher marks. The limitation was the detected challenges with technology and hands-on aspects of Hc.
An investigation was shown to inspect how ecological and administrative influences impact medical staff lacks and their effects on patient preference.(8) Regression analyses of questionnaire information from 104 German hospitals exposed that staff unavailability was significantly related to patient happiness but not to nursing ratios. The research trusted self-reported data, which might introduce inclination. A bi-objective algorithm was developed for the home-based Hc transmitting and planning problem, integrating patient gratification under indecision.(9) A fuzzy method and the Jimenez technique were used to solve the problem. The framework demonstrated the efficiency of PS, but the limitation was its concentration on exact fuzzy parameters, limiting broader usability.
The influence of leadership support on the satisfaction of Hc specialists in crucial care settings was examined.(10) Examinations of nurses, physicians, and organizational staff exposed a positive connection between satisfaction levels and leadership support. However, the outcomes were limited to the primary care context, and the consequences were not related to other types of Hc administrations. Important factors influencing patient understanding were recognized through free-text feedback and qualitative interviews.(11) The outcomes uncovered multiple factors, such as interaction and individual care, which directly compressed patient pleasure. However, the support on personal patient response lacked the applicability of the results to broader Hc settings.
A sustainable Hc supply chain performance model was introduced.(12) The research combined a balanced scorecard (BSC) with an Analytical Network Process (ANP), by conducting in-depth interviews with specialists. The method discovered that customer fulfillment and financial aspects were important drivers. The dependence on expert feedback for information collection was the main drawback of the model. Hc achievement was evaluated in handling chronic infections in Russia, where key performance indicators (KPIs) were insufficient for real decision-making (DM). Research recognized the boundaries of a reactive, diagnosis-centered model and supported a change to a preventive approach. However, the concentration was on Russia, limiting wider relevance.
METHOD
This section explains the data collection process, utilizing a mixed-methods approach that combines quantitative surveys to assess OPIs and PS, along with qualitative interviews with Hc personnel. Important statistical variables were identified using SPSS software to predict PS in Hc organizations. An overview of the methodology is shown in figure 1.
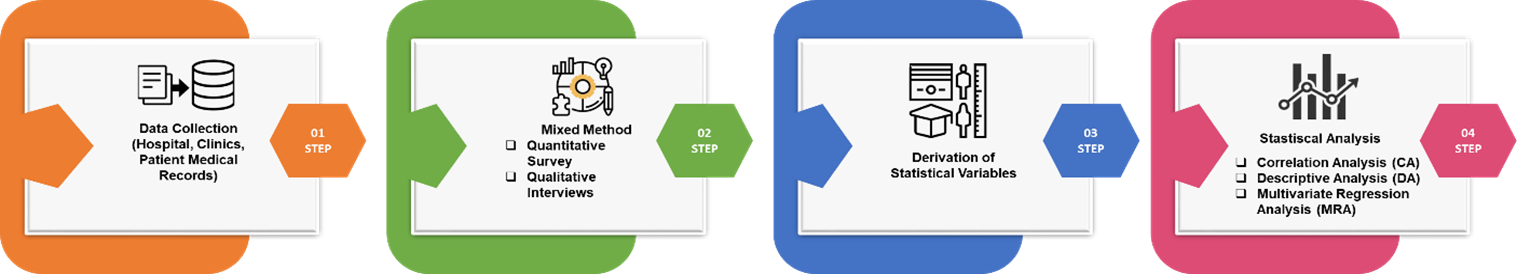
Figure 1. An overview of methodology
Data Collection
Data were collected from various healthcare settings, including clinics, hospitals, and outpatient facilities, to ensure an exhaustive representation. Both patients and people were included in the sample, which was based on the administration’s important performance indicators. Table 1 offers the participants’ demographics, including age, gender, health conditions, and the type of Hc facility.
|
Table 1. Demographic details of the participants |
||
|
Demographic Variable |
Category |
Percentage (%) |
|
Age |
18–30 years |
22 |
|
31–50 years |
34 |
|
|
51–70 years |
28 |
|
|
71+ years |
16 |
|
|
Gender |
Male |
40 |
|
Female |
60 |
|
|
Health Condition |
Chronic illness |
35 |
|
Acute condition |
50 |
|
|
Preventive care |
15 |
|
|
Patient Type |
Inpatient |
45 |
|
Outpatient |
55 |
|
|
Healthcare Facility |
Public Hospital |
60 |
|
Private Hospital |
25 |
|
|
Clinic |
15 |
|
Mixed Method
A mixed-method approach is employed to estimate the connection between OPIs and PS. Quantitative information was gathered through investigations, measuring OPIs and fulfillment levels, while qualitative understandings were increased from interviews with Hc personnel to discover perspectives on service delivery and areas for enhancement.
Quantitative Interviews
Organized interviews were conducted with Hc personnel to collect mathematical information on OPIs. These interviews concentrated on quantifiable metrics such as staff efficiency, resource utilization, and patient outcomes. The replies provided standardized information, permitting the research of OPIs and patient satisfaction across Hc services.
Questionnaire
PS was evaluated through a detailed questionnaire distributed to patients 4 to 12 weeks post-discharge. The investigation enclosed areas such as care excellence, provider interaction, and the hospital’s sustainability performance. Responses were analysed using examining feature analysis to recognize important satisfaction influences, providing valuable understandings of service distribution and patient involvement. Table 2 summarizes the organizational performance indicators in areas that directly and indirectly impact PS in Hc surroundings. Each area contains detailed questions or explanations and quantifiable variables to evaluate performance completely.
|
Table 2. Healthcare organizational performance and patient outcomes |
||
|
Areas of Interest |
Selected Questions/Definition |
Variables Derived |
|
Financial Viability |
How effectively does the hospital manage its financial resources to ensure operational sustainability and quality service delivery? |
Total margin (Percentage difference between revenue and expenses) |
|
Staff Development and Training |
What percentage of healthcare staff participate in continuing education programs supported by the organization (e.g., nursing staff, physicians, other patient care staff)? |
Percentage Participation in training programs |
|
Patient Safety and Quality Policies |
Does the organization have formal policies for patient safety (e.g., hand hygiene, medication reconciliation, disclosure of adverse events)? |
Yes/No for specific safety policies |
|
How often are safety-related metrics (e.g., hospital-acquired infections, unplanned returns to OR, falls) monitored and acted upon? |
Frequency of safety metric reviews |
|
|
Patient Satisfaction |
What percentage of PS with the excellence of care, safety, and the organization’s responsiveness to their needs? |
Patient satisfaction score (%) |
|
Operational Efficiency |
What is the ratio of operational expenses to the hospital’s overall revenue, and how does it impact service delivery? |
Operational efficiency ratio (expenses/revenue) |
|
Technology Adoption and Usage |
How many areas of patient care operations (e.g., medical records, diagnostic reports, clinical documentation) are supported by electronic systems? |
Number of areas using electronic systems |
Quantitative Analysis
Hc evaluates important performance metrics to recognize Personal Efficiency (PE), Resource Management (RM), Patient Care Quality (PCQ), Patient Satisfaction (PS), Hc Service Timeline (HcST). These statistical variables are used to determine correlations, trends, and performance standards, manage developments, and optimize Hc services.
Personal Efficiency (PE)
PE processes the efficiency of Hc suppliers, evaluating how efficiently each specialized service is delivered within a set time. This metric highlights the stability between capacity, patient communications, and time management, prompting overall Hc results and operational efficiency.
Resource Management (RM)
RM assesses the portion and utilization of hospital wealth such as equipment, staff, and facilities. Efficient organization guarantees that resources are optimally used to decrease waste, reduce costs, and maintain high standards of patient maintenance.
Patient Care Quality (PCQ)
PCQ observes the values of attention provided, concentrating on clinical results, observance of finest practices, and overall treatment involvement. High-quality care improves patient recovery, reduces difficulties, and increases health outcomes, directly persuading PS.
Patient Satisfaction (PS)
PS considers patients’ understanding and awareness of the care they receive. This contains influences such as relationships with suppliers, comfort, and responsiveness to needs. High satisfaction is associated with superior patient loyalty, improved health results, and enhanced hospital Integrity.
Healthcare Service Timeline (HcST)
HcST tracks the effectiveness and efficiency of service distribution from patient intake to discharge. It contains wait times, treatment times, and recovery periods. Rationalization timelines develop patient flow, reduce delays, and improve the overall patient experience while safeguarding superior care.
Statistical Analysis (SA)
SA in this research utilizes descriptive analysis, correlation analysis, and multiple regression and were directed using the statistical package for social sciences (SPSS) to evaluate the relationships between significant variables. Descriptive analysis (DA) provides an overview of data distributions, while correlation analysis (CA) identifies interdependencies among factors such as PE, RM, and PS. DA, CA, and multiple regression analysis (MRA) were utilized to investigate the connection between OPIs and PS. MRA further explores these relationships, enabling the prediction of patient outcomes based on various influencing factors.
Correlation Analysis (CA)
The analysis evaluates the direction and strength of connections between variables, with coefficients ranging from 1 (perfect positive correlation) to -1 (perfect negative correlation). It classifies whether changes in one variable are associated with corresponding changes in another. The CA examined the relationships between key variables, such as PE, RM, PCQ, PS, and HcST. CA helps to identify which factors most strongly influence patient outcomes.
Descriptive Analysis (DA)
DA is a statistical method used to summarize and interpret data. It contains processes like central tendency (median, mean, mode), variability (standard deviation, range), and distribution shape (skewness, kurtosis). These help recognize a dataset’s characteristics, such as average values, spread, symmetry, and end behaviour. For example, N is the sample size, the mean shows the average, and the min/max highlights extremes. Graphical tools like charts and graphs aid in identifying patterns and trends, focusing on describing data without predictions.
Multiple Regression Analysis (MRA)
MRA is a statistical method used to evaluate the connection between dependent and multiple independent variables. Important terms contain Unstandardized Coefficients (B), which measure the result of predictors in their original units, and Standardized Coefficients (Beta), which compare variable significance on a common scale. The Standard Error reflects inconsistency in B, while the t-value tests the importance of the predictor. Lower and Upper Bounds (95 %) provide confidence intervals for B. This technique is used to classify predictors’ influence and importance on the result variable.
RESULTS AND DISCUSSION
The results obtained by implementing the statistical methods are shown in this section. The correlation results are shown in table 3 and figure 2, representing a graphical illustration of obtained values.
|
Table 3. Correlation analysis outcomes |
|||||
|
Variables |
PE |
RM |
PCQ |
PS |
HcST |
|
PE |
1,000 |
0,682 |
0,563 |
0,701 |
0,647 |
|
RM |
0,682 |
1,000 |
0,576 |
0,689 |
0,633 |
|
PCQ |
0,563 |
0,576 |
1,000 |
0,763 |
0,681 |
|
PS |
0,701 |
0,689 |
0,763 |
1,000 |
0,732 |
|
HcST |
0,647 |
0,633 |
0,681 |
0,732 |
1,000 |
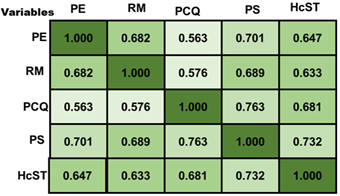
Figure 2. Graphical visualization of correlation results
The CA reveals robust relations between important variables and PS. PE and PS of 0,701 suggest that improving the excellence of care provided to patients is an effective way to improve satisfaction stages. RM and PS (0,689) show that improved resource distribution positively impacts fulfilment. PCQ and PS (0,763) specify high-quality care powerfully correlates with higher satisfaction. HcST and PS (0,732) show a positive but weaker relationship. Improving PE, RM, PCQ, and HCST can significantly enhance patient outcomes. The DA outcomes are shown in table 4 and figure 3, demonstrating a graphical illustration of values produced based on the variables.
|
Table 4. Descriptive analysis outcomes |
|||||||
|
Variable |
N |
Standard Deviation |
Mean |
Minimum |
Maximum |
Skewness |
Kurtosis |
|
PE |
150 |
0,85 |
3,85 |
2,10 |
5,00 |
0,12 |
0,56 |
|
RM |
150 |
0,76 |
4,20 |
2,50 |
5,00 |
0,08 |
0,39 |
|
PCQ |
150 |
0,70 |
4,05 |
2,80 |
5,00 |
0,10 |
0,42 |
|
PS |
150 |
0,80 |
3,95 |
2,60 |
5,00 |
0,15 |
0,58 |
|
HcST |
150 |
0,72 |
4,10 |
2,50 |
5,00 |
0,07 |
0,35 |
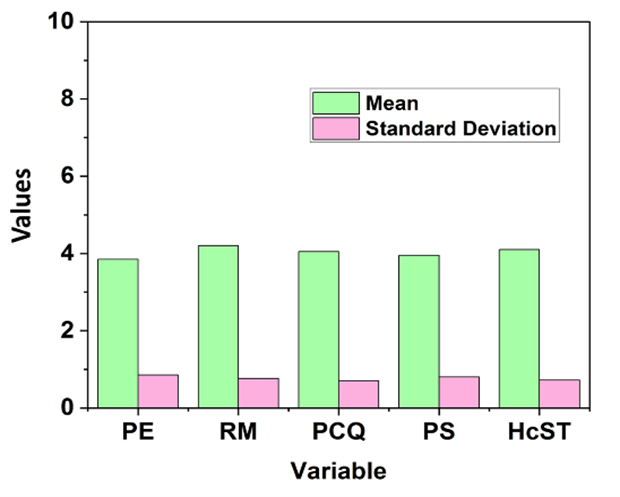
Figure 3. Graphical illustration of mean and standard deviation values
The DA table presents key statistics for five variables: PE, RM, PCQ, PS, and HcST, each with 150 observations. The mean values range from 3,85 to 4,20, indicating overall positive assessments. Minimum and maximum values span from 2,10 to 5,00, showing a broad range of responses. Skewness values are slightly positive, suggesting a mild right skew in the data. Kurtosis values suggest moderately peaked distributions. Standard Deviation values (0,70–0,85) indicate moderate inconsistency across all variables, with PE showing the highest spread. RM performs the highest with a mean of 4,20, indicating the best average score. PE has the lowest performance with a mean of 3,85, though static is high. The DA showed a robust positive correlation between OPIs and PS, highlighting areas for development, including communication and personalized treatment, to improve patient involvement and satisfaction. The MRA results are displayed in table 5 and figure 4 depicts a graphical illustration of obtained values.
|
Table 5. Multiple regression analysis outcomes |
||||||
|
Variable |
Unstandardized Coefficients (B) |
Standard Error |
Standardized Coefficients (Beta) |
t-value |
Lower Bound (95 %) |
Upper Bound (95 %) |
|
PE |
0,210 |
0,045 |
0,350 |
4,667 |
0,121 |
0,299 |
|
RM |
0,180 |
0,050 |
0,310 |
3,600 |
0,081 |
0,279 |
|
PCQ |
0,150 |
0,048 |
0,290 |
3,125 |
0,056 |
0,244 |
|
PS |
0,220 |
0,053 |
0,380 |
4,150 |
0,115 |
0,325 |
|
HcST |
0,160 |
0,045 |
0,300 |
3,555 |
0,070 |
0,250 |
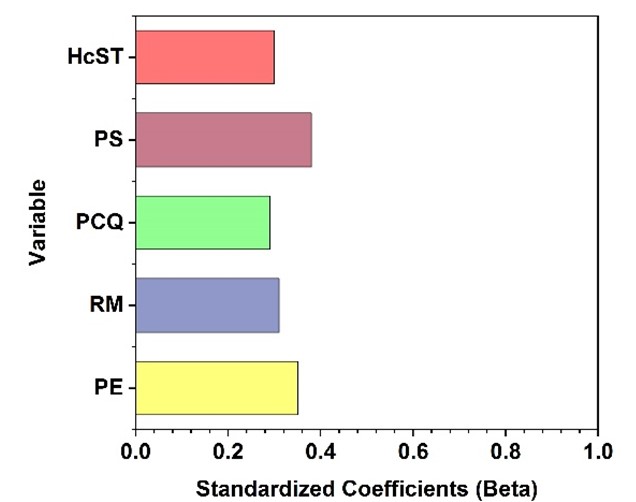
Figure 4. Graphical visualization of standardized coefficients (Beta)
This MRA table evaluates the influence of variables, such as PE, RM, PCQ, PS, and HCST, on a dependent variable. Unstandardized Coefficients (B) specify the raw effect of each predictor on the result. For instance, PE has a coefficient of 0,210, meaning for every unit growth in PE, the dependent variable increases by 0,210. Standardized Coefficients (Beta) show PE (0,350), which has the highest impact. The t-values confirm all predictors are statistically significant, with PE and PS being the effective variables. The analysis helps recognize significant factors affecting PS. Improving PE and PS is essential for improving Hc results and overall patient understanding in Hc administrations.
DISCUSSION
The effect of OPIs on PS in Hc settings is analysed in this research. The correlation coefficient is mentioned as r, in which CA identifies connections between variables. Robust positive correlations are exposed as (r ≥ 0,7) and show important connections; moderate correlations (0,3 ≤ r < 0,7) indicate noticeable impacts, and no correlation (r = 0). In MRA, standard deviation processes data spread, calculated by finding deviations from the mean, squaring, averaging, and taking the square root. It reflects variability and predictor impact. DA summarizes data using mean (average) and standard deviation (variability), highlighting patterns and informing improvement strategies based on how data points deviate from the mean.
CONCLUSIONS
The impact of organizational performance indicators (OPIs) on patient satisfaction (PS) in Hc settings is analysed. Data was collected from various hospitals, clinics, and patient satisfaction investigations to ensure a widespread understanding of important OPIs such as PE, RM, PCQ, and HcST about PS. A mixed-method approach was used, combining quantitative surveys on OPIs and PS, along with qualitative interviews with Hc personnel across different Hc settings. The data was processed using SPSS software involving correlation, descriptive, and regression analyses. The outcomes showed that RM had the highest performance with a mean score of 4,20, representing excellent resource allocation. In contrast, PE performed the lowest with a mean score of 3,85, suggesting areas for development. The investigation exposed a robust positive correlation between the OPIs and PS, highlighting the significance of enhancing important performance indicators like RM and PE to improve PS. These results provide valuable insights into improving Hc delivery through superior performance management. Limitations of this research include the reliance on self-reported data and a limited sample size. Future research could explore broader datasets, examine additional OPIs, and assess long-term impacts on patient satisfaction.
BIBLIOGRAPHIC REFERENCES
1. Kelly CJ, Karthikesalingam A, Suleyman M, Corrado G, King D. Key challenges for delivering clinical impact with artificial intelligence. BMC medicine. 2019 Dec;17:1-9. https://link.springer.com/article/10.1186/s12916-019-1426-2
2. Larson E, Sharma J, Bohren MA, Tunçalp Ö. When the patient is the expert: measuring patient experience and satisfaction with care. Bulletin of the World Health Organization. 2019 Aug 8;97(8):563. https://doi.org/10.2471/BLT.18.225201
3. Lee D. A model for designing healthcare service based on the patient experience. International Journal of Healthcare Management. 2019 Jul 3;12(3):180-8. https://doi.org/10.1080/20479700.2017.1359956
4. Pekkaya M, Pulat İmamoğlu Ö, Koca H. Evaluation of healthcare service quality via Servqual scale: An application on a hospital. International Journal of Healthcare Management. 2019 Oct 2;12(4):340- https://doi.org/10.1080/20479700.2017.1389474
5. Yucesan M, Gul M. Hospital service quality evaluation: an integrated model based on Pythagorean fuzzy AHP and fuzzy TOPSIS. Soft Computing. 2020 Mar;24(5):3237-55. https://link.springer.com/article/10.1007/s00500-019-04084-2
6. Ng JH, Luk BH. Patient satisfaction: Concept analysis in the healthcare context. Patient education and counseling. 2019 Apr 1;102(4):790-6. https://doi.org/10.1016/j.pec.2018.11.013
7. Tenforde AS, Borgstrom H, Polich G, Steere H, Davis IS, Cotton K, O’Donnell M, Silver JK. Outpatient physical, occupational, and speech therapy synchronous telemedicine: a survey study of patient satisfaction with virtual visits during the COVID-19 pandemic. American journal of physical medicine & rehabilitation. 2020 Nov 1;99(11):977-81. https://doi.org/10.1097/PHM.0000000000001571
8. Winter V, Schreyögg J, Thiel A. Hospital staff shortages: Environmental and organizational determinants and implications for patient satisfaction. Health Policy. 2020 Apr 1;124(4):380-8. https://doi.org/10.1016/j.healthpol.2020.01.001
9. Fathollahi-Fard AM, Ahmadi A, Goodarzian F, Cheikhrouhou N. A bi-objective home healthcare routing and scheduling problem considering patients’ satisfaction in a fuzzy environment. Applied soft computing. 2020 Aug 1;93:106385. https://doi.org/10.1016/j.asoc.2020.106385
10. Guevara RS, Montoya J, Carmody-Bubb M, Wheeler C. Physician leadership style predicts advanced practice provider job satisfaction. Leadership in Health Services. 2020 Jan 17;33(1):56-72.
11. Khanbhai M, Flott K, Manton D, Harrison-White S, Klaber R, Darzi A, Mayer E. Identifying factors that promote and limit the effective use of real-time patient experience feedback: a mixed-methods study in secondary care. BMJ open. 2021 Dec 1;11(12):e047239. https://bmjopen.bmj.com/content/11/12/e047239.abstract
12. Leksono EB, Suparno S, Vanany I. Integration of a balanced scorecard, DEMATEL, and ANP for measuring the performance of a sustainable healthcare supply chain. Sustainability. 2019 Jul 2;11(13):3626. https://doi.org/10.3390/su11133626
FINANCING
None.
CONFLICT OF INTEREST
None.
AUTHORSHIP CONTRIBUTION
Conceptualization: Basudev Biswal, Supriya Awasthi, Vandana Sharma.
Data curation: Basudev Biswal, Supriya Awasthi, Vandana Sharma.
Formal analysis: Basudev Biswal, Supriya Awasthi, Vandana Sharma.
Drafting - original draft: Basudev Biswal, Supriya Awasthi, Vandana Sharma.
Writing - proofreading and editing: Basudev Biswal, Supriya Awasthi, Vandana Sharma.