doi: 10.56294/hl2022118
ORIGINAL
Exploring The Mediating Role of Quality Factors Between Healthcare Leadership and Patient Satisfaction
Exploración del papel mediador de los factores de calidad entre el liderazgo sanitario y la satisfacción del paciente
Aruna Singh1 ![]() , Manashree Mane2
, Manashree Mane2 ![]() , Mamata Devi Mohanty3
, Mamata Devi Mohanty3 ![]() , Ashok Kr Sharma4
, Ashok Kr Sharma4 ![]()
1Noida International University, School of Education. Greater Noida, India.
2JAIN (Deemed-to-be University), Department of Forensic Science. Bangalore, India.
3IMS and SUM Hospital, Siksha ‘O’ Anusandhan (Deemed to be University), Department of Paediatrics. Bhubaneswar, India.
4Arya College of Pharmacy. Jaipur, Rajasthan, India.
Cite as: Singh A, Mane M, Mohanty MD, Sharma AK. Exploring The Mediating Role of Quality Factors Between Healthcare Leadership and Patient Satisfaction. Health Leadership and Quality of Life. 2022; 1:118. https://doi.org/10.56294/hl2022118
Submitted: 10-08-2022 Revised: 28-10-2022 Accepted: 13-12-2022 Published: 14-12-2022
Editor:
PhD.
Prof. Neela Satheesh ![]()
Abstract
Introduction: healthcare leadership is pivotal in shaping the quality of care provided to patients. However, the mechanisms through which leadership influences patient satisfaction remain underexplored. Recent research predominantly failed to consider the role of different leadership styles in shaping various dimensions of care quality, leaving a gap in understanding how these factors collectively impact patient satisfaction. The investigation examined the impact of transformational and transactional leadership styles and the mediating effect of quality determinants between patient happiness and healthcare leadership.
Method: a cross-sectional survey collected data from 300 healthcare professionals (nurses, doctors, and administrative staff) and patients across multiple healthcare institutions. Leadership styles were assessed through validated self-report questionnaires. Quality factors were measured using established indicators of communication, responsiveness, and accessibility. Data analysis and testing of the mediating effects of quality parameters were conducted using structural equation modeling (SEM).
Results: the final model demonstrated an excellent fit to the data, with transformational leadership significantly improving quality characteristics, including responsiveness and communication, which improved patient satisfaction. Transactional leadership was also positively associated with care accessibility, which indirectly influenced patient satisfaction.The findings show a significant connection between patient happiness, quality variables, and leadership styles. Strong paths from TL, CO, RE, AC, and TAL to PS were demonstrated by β values ranging from 0,33 to 0,45 and p-values <0,001, indicating the acceptance of all hypotheses.
Conclusions: the findings highlight the importance of developing leadership styles that prioritize quality care and interpersonal communication ultimately enhancing patient experiences and satisfaction in healthcare settings.
Keywords: Leadership; Mediating Role; Quality Factors; Structural Equation Modeling (SEM); Communication.
RESUMEN
Introducción: el liderazgo sanitario es fundamental para determinar la calidad de la atención que se presta a los pacientes. Sin embargo, los mecanismos a través de los cuales el liderazgo influye en la satisfacción de los pacientes siguen siendo poco explorados. En las investigaciones recientes no se ha tenido en cuenta el papel de los distintos estilos de liderazgo en la conformación de las diversas dimensiones de la calidad asistencial, lo que deja un vacío en la comprensión de cómo estos factores influyen colectivamente en la satisfacción de los pacientes. La investigación examinó el impacto de los estilos de liderazgo transformacional y transaccional
y el efecto mediador de los determinantes de la calidad entre la felicidad del paciente y el liderazgo sanitario.
Método: una encuesta transversal recogió datos de 300 profesionales sanitarios (enfermeras, médicos y personal administrativo) y pacientes de varias instituciones sanitarias. Los estilos de liderazgo se evaluaron mediante cuestionarios de autoinforme validados. Los factores de calidad se midieron mediante indicadores establecidos de comunicación, capacidad de respuesta y accesibilidad. El análisis de los datos y la comprobación de los efectos mediadores de los parámetros de calidad se llevaron a cabo mediante un modelo de ecuaciones estructurales (SEM).
Resultados: el modelo final demostró un excelente ajuste a los datos, y el liderazgo transformacional mejoró significativamente las características de calidad, incluidas la capacidad de respuesta y la comunicación, lo que mejoró la satisfacción de los pacientes. El liderazgo transaccional también se asoció positivamente con la accesibilidad de la atención, que influyó indirectamente en la satisfacción de los pacientes. Los valores β, que oscilan entre 0,33 y 0,45 y los valores p <0,001, indican la aceptación de todas las hipótesis.
Conclusiones: los resultados ponen de relieve la importancia de desarrollar estilos de liderazgo que den prioridad a la calidad de la atención y a la comunicación interpersonal, mejorando en última instancia la experiencia y la satisfacción de los pacientes en los centros sanitarios.
Palabras clave: Liderazgo; Función Mediadora; Factores de Calidad; Modelización de Ecuaciones Estructurales (SEM); Comunicación.
INTRODUCTION
Healthcare quality is the key element in assuring the improved delivery of care and satisfaction for patients. Leaders prepare policies, make resource allocation decisions, and create a culture of constant improvement.(1) In healthcare facilities following evidence-based practices and regulatory requirements, leadership fosters accountability and transparency - hallmarks of great care. An optimally led healthcare organization can align its operations more effectively with patient-centered values, leading to improve patient satisfaction.(2) Quality factors such as empathic listening, effective patient interaction, and individualized care significantly affect patient satisfaction. Patient-centered approaches driven by strong leadership equip staff to address patient emotional needs by actively listening to concerns, respecting preferences, and involving in decision-making.(3,4) Higher satisfaction ratings from patients who feel appreciated and understood are more likely to be reported, which benefits the company.Additionally, operational efficiency and safety are crucial quality bridge leadership decisions with patient outcomes. Leaders play a key role in streamlining the healthcare process to minimize resource waste while ensuring patients’ safety.(5) Reductions in wait time, errors, and infections directly enhance patient experiences, creating a safe and efficient environment fosters trust and increases satisfaction further.(6) Frontline healthcare staff reflects leadership and quality initiatives in care delivery emphasizing the importance of leadership in supporting staff training, well-being, and professional development of the workforce. Inspired, well-supported staff are better placed to maintain positive attitudes and deliver consistent, high-quality care, forming a crucial foundation for patient satisfaction.(7,8) The limitation of research on the relationship between quality factors and healthcare leadership and patient satisfaction can be embedded in the assessment of patient experience and leadership effectiveness. External factors, such as resource constraints and cultural differences, also affect outcomes. Standardized tools for assessment, diverse datasets, and leadership training consider organizational contexts can help overcome these challenges. The investigation explored the transformational and transactional leadership styles on affected patient satisfaction and examined how quality attributes mediate the relationship between patient satisfaction and healthcare leadership.
Research Contributions
· Data from 300 patients and healthcare workers from various institutions provide a comprehensive view of quality and leadership aspects in healthcare.
· The impact of both transformational and transactional leadership styles enhanced accountability, communication, and healthcare accessibility.
· The role that quality characteristics play as mediators in the link between leadership styles and patient satisfaction has provided new insights for healthcare management.
· The relationships were confirmed using the Structural Equation Modeling (SEM). The approach provided a robust analytical framework for future research.
· Some additional analyses were carried out to improve the research, including pathway estimates, measurement model fit, and discriminant validity.
· It offers actionable evidence to healthcare institutions in terms of the need to develop leadership for improved patient satisfaction and overall quality of care.
Structure of the research
The rest of the research is broken down into phrases, such as phrase 2 showing the literature reviews, phrase 3 showing the methods, phrase 4 explaining the findings, phrase 5 outlining the discussion, and phrase 6 offering the conclusion.
Literature review
Nurse supervisors’ work activities, nurses’ job happiness, medication errors at the hospital unit level, and patient health are all examined in.(9) Between April and November 2017, medication errors in 28 acute care hospitals in Finland were investigated using Analysis of Co-Variance (ANCOVA) to assess associations and unstandardized regression coefficients. Medication mistakes, job happiness, and patient satisfaction are all greatly impacted by the research activities of nurse managers; the most important subarea was the required aspects of work. To determine the causes and effects of internal service quality (ISQ) in a healthcare setting estimated in.(10) A 37-item survey with 238 valid answers was given to Indian healthcare practitioners to create a structural model. A literature served as the basis for the SEM used to examine the data. To promote internal customer satisfaction and patient-centricity in the healthcare industry it was found that a varied workplace, coordinated care, and patient-centeredness (POS) were essential components. To examine how patients felt about the quality of care to find out what demographic characteristics affected patients’ opinions were analyzed in.(11) The planned 367 adult patients in Oman’s obstetrics, surgery, and medical departments were surveyed using the updated humane caring scale.
The findings demonstrated there is a high sense of professionalism and high-quality treatment, despite a minimal awareness of human resources and physical demands. The research recommends improving understanding of human resources and physical demands, and attending to the specific needs of each patient, especially those admitted to the emergency room.
To enhance physician well-being, engagement, and professional fulfillment, the approach attempts to integrate evidence-based tactics with successful leadership philosophies that were recommended in.(12) The Wellness-Centered Leadership (WCL) model distills fundamental abilities and traits from well-known leadership philosophies into a framework intended for leaders in the healthcare industry. The model places a strong emphasis on abilities and conduct improving both individual and team performance by coordinating leadership tactics with the values of healthcare workers. Developing a novel and conversant leadership theory(13) suggested capturing the spirit of nursing in a challenging healthcare setting. Through co-creative experience and data, constructivist grounded theory investigates human problems in nursing leadership. Over 18 months, 39 nurse leaders participated in focus groups. The hypothesis possible consequences of greatness, trust, and care were linked to 15 traits of advanced coding found and categorized into three constructs, which include Awakener, Connector, and Upholder.
To investigate the connection between patient satisfaction and waiting times at a Saudi Arabian tertiary hospital examined in.(14) Using a standardized questionnaire given to outpatient patients, a cross-sectional were carried out in family medicine and specialty clinics to investigate the connection between waiting time and patient satisfaction. Half of the 406 patients in the assessment expressed satisfaction with times, and family medicine clinics outperformed other specialty clinics in this regard. Satisfactions were higher among patients treated at family medicine clinics. To assess how satisfied patients were with the standard of nursing care provided in thalassemia units investigated in.(15) In an Arabic-language survey of 377 thalassemia patients from three public hospitals in Jordan, respondents expressed satisfaction with the nursing care they got while they were in the hospital based on evaluations for nursing competence, privacy, and accessibility.
A few primary healthcare facilities in the Al Qassim region of the Kingdom of Saudi Arabia(16) were analyzed to assess the relationship between patient satisfactions and wait times. Patients’ satisfaction with the care received at health centers, including wait times for registration, payment, and medicine distribution, was found in an evaluation of 850 patients in Al Qassim City. According to the investigation’s 72,94 % response rate, 27,90 % of participants expressed dissatisfaction with the wait times for dental consultations, radiological investigations, medication distribution, and vital sign monitoring.
Hypothesis Framework
Transformational leadership enhances communication and responsiveness improving patient satisfaction, communication and responsiveness directly influence, which also positively impacts patient satisfaction. Figure 1 shows the conceptual framework.
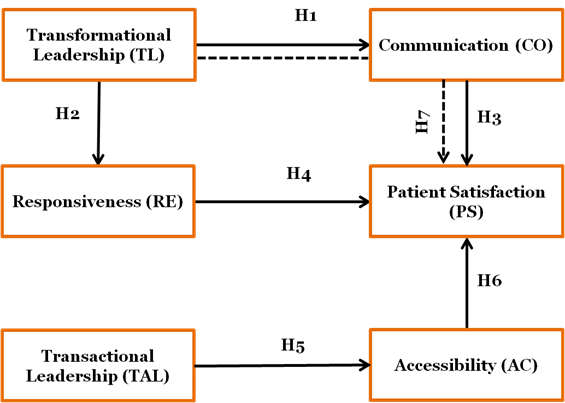
Figure 1. Conceptual Framework for Healthcare Leadership and Patient Satisfaction
H1: Transformational Leadership (TL) positively impacts the Communication (CO) quality factor in healthcare settings
TL’s primary goal is to encourage and inspire team members to go above and beyond expectations. Healthcare institutions also ensure proper CO between the provider and patients utilizing transformational leadership styles.
H2: Transformational Leadership (TL) positively impacts the Responsiveness (RE) quality factor in healthcare settings
TL is associated with a culture of alertness and proactively problem-solving. Transformational leadership improves responsiveness in healthcare patients receive quicker and more appropriate responses to needs and questions.
H3: Communication (CO) quality factor positively impacts Patient Satisfaction (PS) in healthcare settings
The quality of communication in healthcarehighly influences PS. Effective and empathetic, clear communication helps the patient feel understood, heard, and respected by the health team, thereby contributing to a positivehealthcare experience.
H4: Responsiveness (RE) quality factor positively impacts Patient Satisfaction (PS) in healthcare settings
In the context of health, RE is the prompt attention to a patient’s demands that are directly connected to PS. The patient has a lot of faith in the system because of its prompt resolution and attentiveness.
H5: Transactional Leadership (TAL) positively impacts the Accessibility (AC) quality factor in healthcare settings
TALrelies on structured processes and clearly defined goals to improve access for more patients to healthcare services. It focuses on efficiency and accountability to ensure the patient enjoys a fair use of resources and services.
H6: Accessibility (AC) quality factor positively impacts Patient Satisfaction (PS) in healthcare settings
AC can determine the basis for patient satisfaction. The patient feels less tense and more comfortable when healthcare services are accessed without difficulty.
H7: Transformational Leadership (TL) positively impacts Patient Satisfaction (PS) in healthcare settings, mediated by Communication (CO)
TL directly influences patient satisfaction by motivating healthcare providers to communicate effectively with patients. TL-enhanced communication acts as a mediator, ensuring the leadership style not only inspires the workforce but also directly contributes to an improved patient experience and satisfaction in healthcare settings.
METHOD
The standardized self-administered tools evaluated leadership styles; quality factors include communication, responsiveness, and accessibility with indicators in case measure. It utilized SEM to derive relationships and for effectual testing of the mediating aspects.
Data Collection
A total of 300 respondents were selected using stratified sampling, which allowed for representation in different roles and institutions. Self-report questionnaires to assess leadership style, communication, responsiveness, accessibility, and patient satisfaction were validated tools. The distribution of the questionnaires was made online and personally depending on participants’ availability and preferences of institutions.
Questionnaire
Table 1 questionnaire item includes items from the table outlining the assessment of leadership styles (Transformational and Transactional) and key quality factors in healthcare settings, such as communication, responsiveness, and accessibility. The questions focus on the driving force of leadership inspiring and controlling the performance of people, communication, timely response, and accessibility in delivering services. These are crucial to comprehending how factor affect patient experiences and satisfaction in healthcare settings. The responses particularly provide an understanding of how leadership and quality factors contribute to healthcare outcomes.
|
Table 1. Self-Report Questionnaire for Leadership Styles and Quality Factors in Healthcare |
||
|
Factors |
Items |
Questions |
|
TL |
TL 1 |
The leader inspires and motivates the team to go beyond basic responsibilities. |
|
TL 2 |
The leader encourages innovation and new ideas in the workplace. |
|
|
TAL |
TAL1 |
The leader sets clear expectations and follows up on performance regularly. |
|
TA-L 2 |
The leader rewards employees when they meet or exceed targets. |
|
|
CO |
CO1 |
The information individual receives from healthcare providers is clear and easy to understand. |
|
CO2 |
Healthcare providers actively listen to individual concerns and respond appropriately. |
|
|
RE |
RE1 |
Healthcare providers respond to participant needs promptly. |
|
RE2 |
The individual receives the help the individual needs without significant delays in healthcare settings. |
|
|
AC |
AC1 |
Healthcare services are easily accessible when the individual needs them. |
|
AC2 |
The participant can quickly schedule appointments or receive assistance when required. |
|
|
PS |
PS1 |
Overall, the participant is satisfied with the healthcare services the participant received. |
|
PS2 |
The participant would recommend the healthcare facility to others. |
|
Explanation of Analytical Approach
Leadership styles and quality variables are two key characteristics that are thought to affect patient satisfaction. The research uses SEM to explore hypothesized correlations and mediation effects between these two constructs. SEM allows both direct and indirect relationships to be tested simultaneously by considering numerous variables at once. Before SEM, Exploratory Factor Analysis (EFA) determines the underlying factors that validate the structure of the measurement model. A correlation analysis to examine the linkages between the variables and, reliability tests of the measurement scale such as Cronbach’s alpha measure, ensures consistency and validity are ensured.
RESULTS
The demographic information about the respondents and an estimate of the measuring model are included in the findings. Other research, including discriminant validity, path estimations, and measurement model fit are included. These results show the association between patient happiness and healthcare leadership is mediated by quality qualities.
Demographic data
The demographic specifics of the 300 research participants are shown in table 2,which is broken down by age, gender, healthcare role, healthcare facility type, preferred leadership style, and healthcare technology use. The age distribution spans multiple age groups, with a significant portion of participants between 25-34 years. Gender is predominantly female (60 %). The majority of participants are nurses (33,3 %), working in hospitals (60 %). Most participants prefer transformational leadership (60 %) and regularly engage in technology use in healthcare (70 %). The demographic breakdown ensures a representative sample for the analysis of leadership styles and patient satisfaction. Figure 2 illustrates the demographic characteristics, including (A) Technology use in health care, (B) Type of healthcare facility, (C) leadership style preference, (D) Healthcare Roles. These visuals provide insights into the diverse aspects of the research population.
|
Table 2. Demographic Distribution of Participants (n=300) |
|||
|
Demographic Variables |
Category |
Frequency (n = 300) |
Percentage (%) |
|
Age |
18-24 years |
50 |
16,7 |
|
25-34 years |
75 |
25,0 |
|
|
35-44 years |
60 |
20,0 |
|
|
45-54 years |
50 |
16,7 |
|
|
55+ years |
65 |
21,6 |
|
|
Gender |
Male |
120 |
40,0 |
|
Female |
180 |
60,0 |
|
|
Healthcare Role |
Nurse |
100 |
33,3 |
|
Doctor |
90 |
30,0 |
|
|
Administrative Staff |
60 |
20,0 |
|
|
Other (e.g., Technician, Support) |
50 |
16,7 |
|
|
Type of Healthcare Facility |
Hospital |
180 |
60,0 |
|
Clinic |
90 |
30,0 |
|
|
Private Practice |
30 |
10,0 |
|
|
Leadership Style Preference |
Transformational Leadership |
180 |
60,0 |
|
Transactional Leadership |
120 |
40,0 |
|
|
Technology Use in Healthcare |
Regularly Use Technology (e.g., online booking, telemedicine) |
210 |
70,0 |
|
Occasionally Use Technology |
60 |
20,0 |
|
|
Do Not Use Technology |
30 |
10,0 |
|
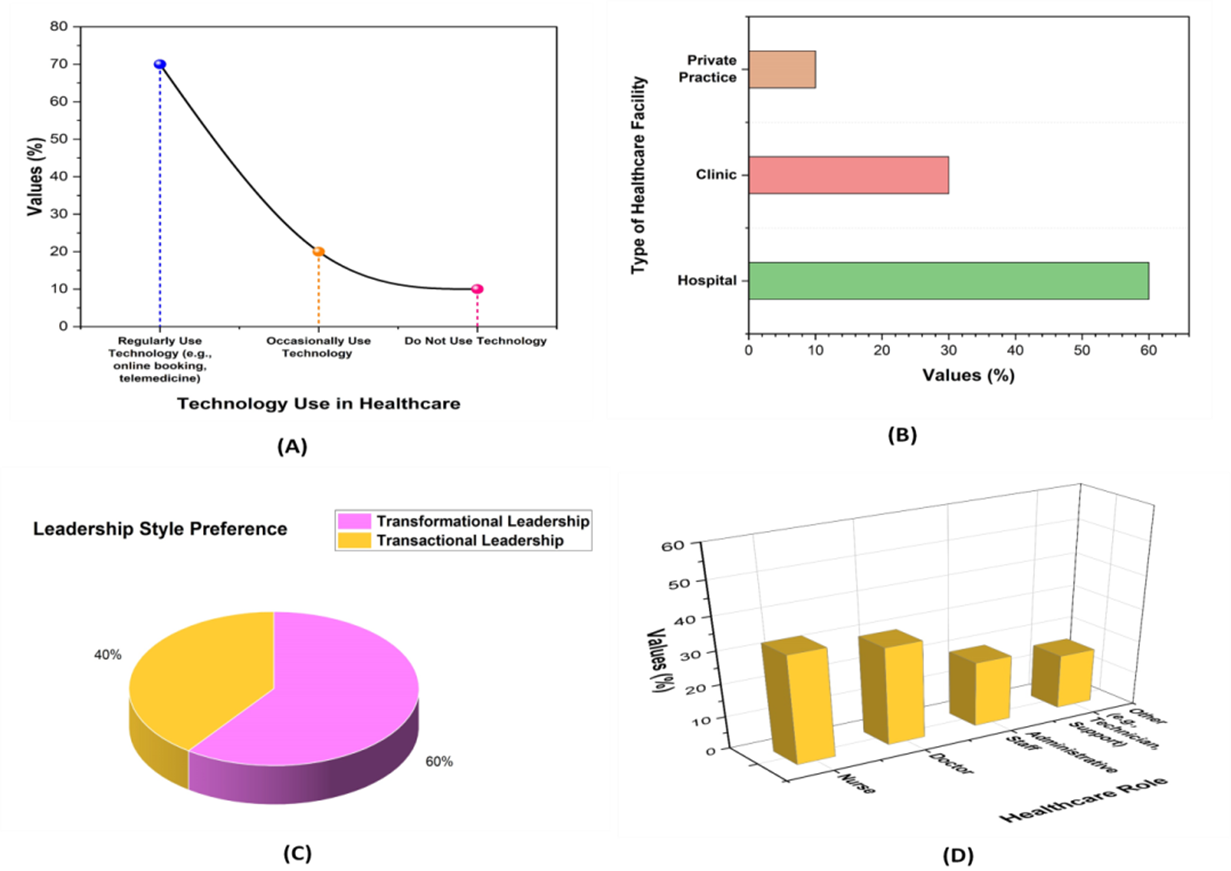
Figure 2. Demographic Characteristics: (A) Technology use in Health care, (B) Type of Healthcare facility, (C) leadership style preference, (D) Healthcare Role
Estimation of the measurement model
EFA identifies the underlying factors validating the measurement model for TL, TAL, CO, RE, AC, and PS. It ensures items are grouped correctly under each factor, confirming construct validity. Figure 3 shows a visual representation of the measurement model.
|
Table 3. Validity and Reliability of Measurement Models |
|||||
|
Factors |
Items |
FL |
CR |
α |
AVE |
|
TL |
TL1 |
0,81 |
0,90 |
0,88 |
0,73 |
|
TL2 |
0,84 |
||||
|
TAL |
TAL1 |
0,79 |
0,88 |
0,86 |
0,68 |
|
TAL2 |
0,75 |
||||
|
CO |
CO1 |
0,80 |
0,87 |
0,84 |
0,72 |
|
CO2 |
0,77 |
||||
|
RE |
RE1 |
0,82 |
0,89 |
0,87 |
0,74 |
|
RE2 |
0,80 |
||||
|
AC |
AC1 |
0,78 |
0,85 |
0,83 |
0,67 |
|
AC2 |
0,76 |
||||
|
PS |
PS1 |
0,84 |
0,91 |
0,89 |
0,76 |
|
PS2 |
0,83 |
||||
|
Note: composite Reliability (CR), Factor Loading (FL), Cronbach’s Alpha (α), and Average Variance Extracted (AVE) |
|||||
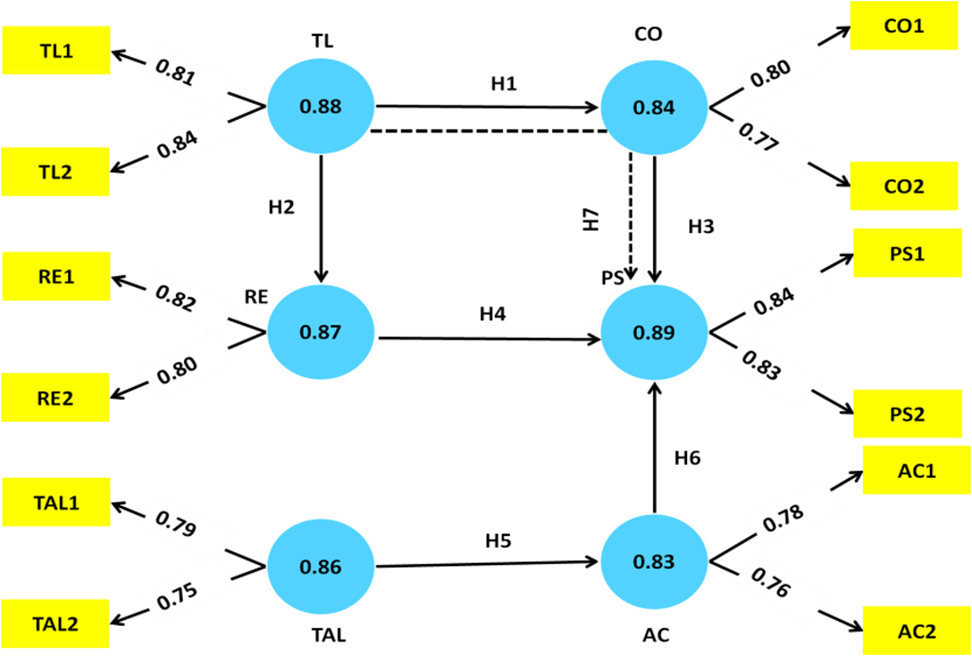
Figure 3. The Structural Equation Modeling
Table 3 presents the validity and reliability statistics for the factors in the research: TL, TAL, CO, RE, AC, and PS, based on a sample size of 300. The FL indicates each item is an excellent indicator of its latent construct, with values ranging from 0,75 to 0,84, demonstrating strong correlations between items and respective factors. The questions in each factor consistently measure the same construct, as indicated by the CR values of each factor, which vary from 0,85 to 0,91 and over the acceptable threshold of 0,70. The reliability of the scales is further demonstrated by the strong internal consistency indicated by the αvalue, which ranges from 0,83 to 0,89. The factors account for a reasonable amount of variance in relevant items, as evidenced by the AVE values, which range from 0,65 to 0,76 and the minimum allowed value of 0,50.
Discriminant Validity Analysis
Discriminant validity ensures the factors in a measurement model are distinct and not highly correlated with each other. For the objective Quality Factors between healthcare leadership and patient satisfaction, discriminant validity analysis confirms factors, such as TL, TAL, CO, RE, AC, and PS measure unique constructs without overlap.
|
Table 4. Discriminant Validity Analysis for Quality Factors in Healthcare Leadership and Patient Satisfaction |
||||||
|
Factor |
TL |
TAL |
CO |
RE |
AC |
PS |
|
TL |
0,75 |
0,42 |
0,50 |
0,47 |
0,40 |
0,60 |
|
TAL |
0,42 |
0,76 |
0,45 |
0,43 |
0,41 |
0,52 |
|
CO |
0,50 |
0,45 |
0,73 |
0,55 |
0,50 |
0,61 |
|
RE |
0,47 |
0,43 |
0,55 |
0,74 |
0,53 |
0,59 |
|
AC |
0,40 |
0,41 |
0,50 |
0,53 |
0,70 |
0,62 |
|
PS |
0,60 |
0,52 |
0,61 |
0,59 |
0,62 |
0,80 |
Table 4 presentthe correlation matrix for the various factors in TL, TAL, CO, RE, AC, and PS. Values along the diagonal = 0,75 (for TL), are the internal consistency or correlation of the factor with itself. The values off-diagonal give the association between two factors, ahigher value indicating a strong association between factors. TL shows a moderate correlation with PS (0,60) and CO (0,50). These correlations help in understanding how leadership styles and quality factors influence patient satisfaction and healthcare outcomes.
Measurement model fit
The measurement model fit for healthcare leadership and patient satisfaction components evaluates the goodness of fit of the proposed model using indices such as χ², RMSE, CFI, SRMR, χ²/df, and TLI. Every fit index shows a satisfactory model fit, with values falling within the suggested SEM levels.
|
Table 5. Measurement model fit indices for healthcare leadership and patient satisfaction factors |
|||||||
|
Factors |
χ² |
df |
RMSE |
CFI |
SRMR |
χ²/df |
TLI |
|
TL |
22,40 |
14 |
0,05 |
0,92 |
0,04 |
1,60 |
0,90 |
|
TAL |
24,60 |
16 |
0,06 |
0,90 |
0,05 |
1,53 |
0,88 |
|
CO |
27,80 |
15 |
0,05 |
0,93 |
0,04 |
1,85 |
0,91 |
|
RE |
23,40 |
13 |
0,05 |
0,91 |
0,06 |
1,80 |
0,89 |
|
AC |
21,90 |
12 |
0,07 |
0,89 |
0,06 |
1,83 |
0,87 |
|
PS |
25,30 |
14 |
0,05 |
0,94 |
0,04 |
1,81 |
0,90 |
|
Note: Chi-square per degree of freedom (χ²/df), the Tucker-Lewis Index (TLI), the Standardized Root Mean Square Residual (SRMR), the Root Mean Square Error (RMSE), degrees of freedom (df), and Chi-square-χ² |
|||||||
The measurement model fit table 5 presents fit indices for the six factors: TL, TAL, CO, RE, AC, and PS, based on data with n=300. The χ² values range from 21,90 to 27,80, and df vary between 12 and 16. The RMSE values indicate good model fit, typically less than 0,08. The CFI values range from 0,89 to 0,94, suggesting a good model fit. SRMR values are all below 0,07, confirming a good fit. The χ²/df ratio is below 2, supporting an appropriate model fit. TLI values are between 0,87 and 0,91, indicating an acceptable fit for the model.
Pathway Estimation
The pathway estimation table 6 and figure 4 present the relationships explored between healthcare leadership factors and patient satisfaction through various quality factors. Hypothesis 7 (TL → CO → PS) indicates a chain effect where transformational leadership influences communication, which in turn positively impacts patient satisfactionwith a β value of 0,45 and a significant p-value (<0,001). The indirect pathway emphasizes the importance of communication in translating leadership into enhanced patient experiences. All hypotheses remain accepted, indicating each factor and its pathway significantly contribute to patient satisfaction in healthcare settings.
|
Table 6. Pathway Estimation for Quality Factors in Healthcare Leadership and Patient Satisfaction |
|||||||
|
Hypothesis |
Pathway |
β |
SE |
CI |
t |
p-value |
Accepted / Not Accepted |
|
H1 |
TL → CO |
0,45 |
0,07 |
[0,31, 0,59] |
6,43 |
<0,001 |
Accepted |
|
H2 |
TL → RE |
0,38 |
0,06 |
[0,26, 0,50] |
6,33 |
<0,001 |
Accepted |
|
H3 |
CO → PS |
0,42 |
0,08 |
[0,26, 0,58] |
5,30 |
<0,001 |
Accepted |
|
H4 |
RE → PS |
0,36 |
0,07 |
[0,23, 0,49] |
5,14 |
<0,001 |
Accepted |
|
H5 |
TAL → AC |
0,40 |
0,07 |
[0,26, 0,54] |
5,71 |
<0,001 |
Accepted |
|
H6 |
AC → PS |
0,33 |
0,06 |
[0,21, 0,45] |
5,50 |
<0,001 |
Accepted |
|
H7 |
TL → CO → PS |
0,45 |
0,07 |
[0,31, 0,59] |
6,43 |
<0,001 |
Accepted |
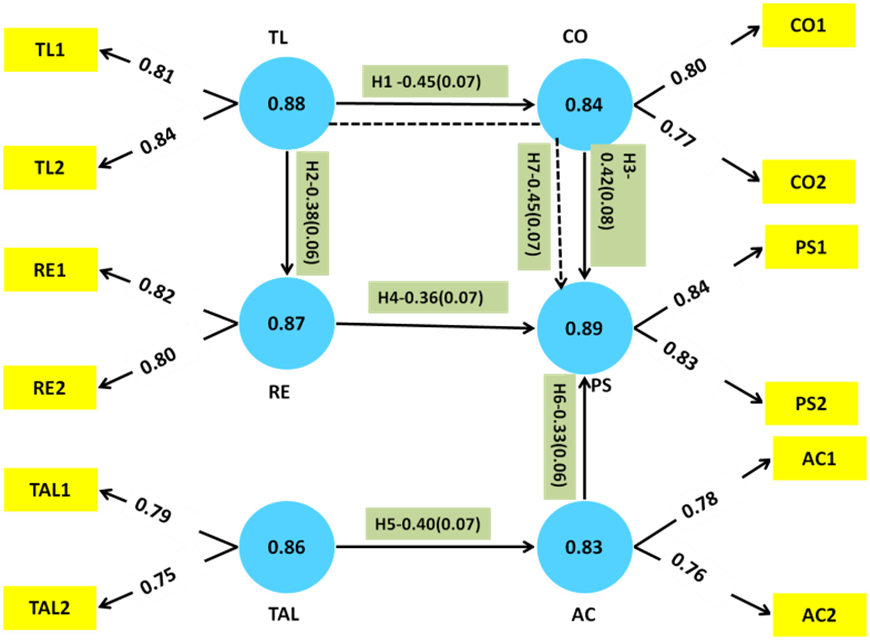
Figure 4. Pathway Estimation of Hypothesis
Findings of the research
The analysis confirmed α ranged from 0,83 to 0,89, CR from 0,85 to 0,91, AVE from 0,65 to 0,76, and factor loadings from 0,75 to 0,84, which supported the measurement model’s robustness. The results of the discriminant validity research indicated patient happiness, quality variables, and leadership styles were moderate to strongly correlated. The measurement model fit indices demonstrated exceptional match and demonstrated strong connections between leadership styles, quality attributes, and patient happiness.
DISCUSSION
The important influences of leadership style on quality characteristics impact customer satisfaction in hospitals. Transformational leadership was indeed significantly positively influential on communication and responsiveness, establishing inspiring behavior and motivation have an important part to play concerning improving effective information dissemination and timely replies to patient service needs. The transactional leadership had positive effects toward improved accessibility-the clear expectations define rewards mean the efficient supply of services by those concerned. The finding indicates proper information flows improve patient satisfaction. The attributes of responsiveness and accessibility further indicate proper patient satisfaction can take place through fast care provision by easy accessibility for healthcare. Through the indirect influence of transformational leadership on the patient’s experience, one indicates an overlap with communication, linking these aspects to each other. Based on these findings, the overall quality of care and experience of care at healthcare institutions can be greatly improved through appropriate leadership styles. Hence, a healthy interest in leadership development based on quality factors can enhance patient satisfaction and service delivery.
CONCLUSIONS
The three main quality characteristics are communication, responsiveness, and accessibility that moderate the relationship between patient happiness and healthcare leadership. The two leadership styles transformational and transactional- shape these factors and directly influence the experiences of patients. Transactional leadership affected accessibility (β = 0,40), whereas transformational leadership had a substantial impact on responsiveness (β = 0,38), and communication (β = 0,45). All assumptions were confirmed by the positive mediating effects of communication, responsiveness, and accessibility on the relationship with patient satisfaction. The limitation of being cross-sectional, which limits inferences of causality, and also depends on self-reported data, which can be prone to bias. Longitudinal designs can be further considered to understand causal relationships and diversified healthcare settings to generalize to a larger extent. Other leadership styles and quality factors can also provide further insight into patient satisfaction dynamics.
BIBLIOGRAPHIC REFERENCES
1. Tan CN, Ojo AO, Cheah JH, Ramayah T. Measuring the influence of service quality on patient satisfaction in Malaysia. Quality Management Journal. 2019 Jul 3;26(3):129-43. https://doi.org/10.1080/10686967.2019.1615852
2. Chakraborty S, Kaynak H, Pagan JA. Bridging hospital quality leadership to patient care quality. International Journal of Production Economics. 2021 Mar 1;233:108010. https://doi.org/10.1016/j.ijpe.2020.108010
3. Huhtala M, Geurts S, Mauno S, Feldt T. Intensified job demands in healthcare and their consequences for employee well‐being and patient satisfaction: A multilevel approach. Journal of advanced nursing. 2021 Sep;77(9):3718-32. https://doi.org/10.1111/jan.14861
4. Stoller JK. Emotional intelligence: leadership essentials for chest medicine professionals. Chest. 2021 May 1;159(5):1942-8. https://doi.org/10.1016/j.chest.2020.09.093\
5. Gottlieb LN, Gottlieb B, Bitzas V. Creating empowering conditions for nurses with workplace autonomy and agency: how healthcare leaders could be guided by strengths-based nursing and healthcare leadership (SBNH-L). Journal of Healthcare Leadership. 2021 Jul 27:169-81. https://doi.org/10.2147/JHL.S221141
6. Stefanini A, Aloini D, Gloor P, Pochiero F. Patient satisfaction in emergency department: Unveiling complex interactions by wearable sensors. Journal of Business Research. 2021 May 1;129:600-11. https://doi.org/10.1016/j.jbusres.2019.12.038
7. Boamah SA. Emergence of informal clinical leadership as a catalyst for improving patient care quality and job satisfaction. Journal of Advanced Nursing. 2019 May;75(5):1000-9. https://doi.org/10.1111/jan.13895
8. Kline M, McNett M. The impact of daily executive rounding on patient satisfaction scores. Nurse Leader. 2019 Oct 1;17(5):440-4. https://doi.org/10.1016/j.mnl.2018.12.018
9. Nurmeksela A, Mikkonen S, Kinnunen J, Kvist T. Relationships between nurse managers’ work activities, nurses’ job satisfaction, patient satisfaction, and medication errors at the unit level: a correlational study. BMC Health Services Research. 2021 Dec;21:1-3.https://doi.org/10.1186/s12913-021-06288-5
10. Al-Awamreh K, Suliman M. Patients’ satisfaction with the quality of nursing care in thalassemia units. Applied Nursing Research. 2019 Jun 1;47:46-51. https://doi.org/10.1016/j.apnr.2019.05.007
11. Al-Jabri FY, Turunen H, Kvist T. Patients’ perceptions of healthcare quality at hospitals measured by the revised humane caring scale. Journal of patient experience. 2021 Dec;8:23743735211065265. https://doi.org/10.1177/23743735211065265
12. Shanafelt T, Trockel M, Rodriguez A, Logan D. Wellness-centered leadership: equipping health care leaders to cultivate physician well-being and professional fulfillment. Academic Medicine. 2021 May 1;96(5):641-51. https://doi.org/10.1097/ACM.0000000000003907
13. Leclerc L, Kennedy K, Campis S. Human‐centred leadership in health care: A contemporary nursing leadership theory generated via constructivist grounded theory. Journal of nursing management. 2021 Mar;29(2):294-306. https://doi.org/10.1111/jonm.13154
14. Prakash G, Srivastava S. Role of internal service quality in enhancing patient centricity and internal customer satisfaction. International Journal of Pharmaceutical and Healthcare Marketing. 2019 Apr 3;13(1):2-0. https://doi.org/10.1108/IJPHM-02-2018-0004
15. Al-Harajin RS, Al-Subaie SA, Elzubair AG. The association between waiting time and patient satisfaction in outpatient clinics: Findings from a tertiary care hospital in Saudi Arabia. Journal of family and community medicine. 2019 Jan 1;26(1):17-22. https://doi.org/10.4103/jfcm.JFCM_14_18
16. Alrasheedi KF, Al-Mohaithef M, Edrees HH, Chandramohan S. The association between wait times and patient satisfaction: findings from primary health centers in the Kingdom of Saudi Arabia. Health services research and managerial epidemiology. 2019 Jul 8;6:2333392819861246. https://doi.org/10.1177/2333392819861246
FINANCING
None.
CONFLICT OF INTEREST
None.
AUTHORSHIP CONTRIBUTION
Conceptualization: Aruna Singh, Manashree Mane, Mamata Devi Mohanty, Ashok Kr Sharma.
Data curation: Aruna Singh, Manashree Mane, Mamata Devi Mohanty, Ashok Kr Sharma.
Formal analysis: Aruna Singh, Manashree Mane, Mamata Devi Mohanty, Ashok Kr Sharma.
Drafting - original draft: Aruna Singh, Manashree Mane, Mamata Devi Mohanty, Ashok Kr Sharma.
Writing - proofreading and editing: Aruna Singh, Manashree Mane, Mamata Devi Mohanty, Ashok Kr Sharma.