doi: 10.56294/hl2022115
ORIGINAL
Investigating the Impact of Urban Air Pollution on Respiratory Health in Occupational Settings
Investigación del Impacto de la Contaminación Atmosférica Urbana en la Salud Respiratoria en Entornos Ocupacionales
Banani Jena1
![]() , Hari Narayan Hota2
, Hari Narayan Hota2
![]() , Jamuna. K.V3
, Jamuna. K.V3
![]() , Mukesh Sharma4
, Mukesh Sharma4 ![]()
1IMS and SUM Hospital, Siksha ‘O’ Anusandhan (Deemed to be University), Department of Respiratory Medicine. Bhubaneswar, India.
2Noida International University, School of Education. Greater Noida, India.
3JAIN (Deemed-to-be University), Department of Forensic Science. Bangalore, India.
4Arya College of Pharmacy. Jaipur, India.
Cite as: Jena B, Hota HN, Jamuna K, Sharma M. Investigating the Impact of Urban Air Pollution on Respiratory Health in Occupational Settings. Health Leadership and Quality of Life. 2022; 1:115. https://doi.org/10.56294/hl2022115
Submitted: 09-08-2022 Revised: 27-10-2022 Accepted: 12-12-2022 Published: 13-12-2022
Editor:
PhD.
Prof. Neela Satheesh ![]()
ABSTRACT
The urban environment is a massive chemical generator where contaminants like hydrocarbon sulfur and nitrogen oxides react with solar to generate a range of products, such as ozone and dust particles. Consequently, certain regions are substantially exposed to harmful environmental influences, especially air pollution. To improve the pollution-free environment in occupational settings, the impact of different respiratory conditions and their effects on the individual is assessed. Industrial operations, construction, and vehicle emissions expose urban areas to various air pollutants. To determine the impact of urban air pollution a collection of 150 individuals from food service, transportation, and construction is selected and the respiratory health with the consequences based on participants are evaluated based on demographic and occupational exposure. Questionnaires are developed based on breathing symptoms such as phlegm, throat irritations, chest discomfort, wheezing, and stuffy nose. Significant variables such as forced expiratory volume in one second (FEV1) and forced vital capacity (FVC) have been taken into consideration in monitoring the respiratory systems’ condition. Statistical analysis technique with SPSS version 25 is employed for effective performance. A statistical technique includes multiple regression analysis for three various domains food service, transportation, and construction are explored more significantly in the field of examining the way respiratory health is affected by urban air pollution in occupational environments.
Keywords: Urban Environment; Industrial Operations; Urban Air Pollution; Health; Breathing Symptoms.
RESUMEN
El entorno urbano es un enorme generador químico donde contaminantes como los hidrocarburos de azufre y los óxidos de nitrógeno reaccionan con el sol para generar una serie de productos, como el ozono y las partículas de polvo. En consecuencia, determinadas regiones están sustancialmente expuestas a influencias medioambientales nocivas, especialmente a la contaminación atmosférica. Para mejorar el entorno libre de contaminación en entornos ocupacionales, se evalúa el impacto de diferentes afecciones respiratorias y sus efectos sobre el individuo. Las operaciones industriales, la construcción y las emisiones de los vehículos exponen a las zonas urbanas a diversos contaminantes atmosféricos. Para determinar el impacto de la contaminación atmosférica urbana se selecciona una colección de 150 individuos de los servicios de alimentación, transporte y construcción y se evalúa la salud respiratoria con las consecuencias basadas en los participantes en función de la exposición demográfica y ocupacional. Se elaboran cuestionarios basados en síntomas respiratorios como flemas, irritaciones de garganta, molestias en el pecho, sibilancias y congestión nasal. Se han tenido en cuenta variables significativas como el volumen espiratorio forzado en un segundo
(FEV1) y la capacidad vital forzada (FVC) para controlar el estado de los sistemas respiratorios. Se ha empleado la técnica de análisis estadístico SPSS versión 25 para un rendimiento eficaz. Se explora de forma más significativa una técnica estadística que incluye el análisis de regresión múltiple para tres ámbitos distintos: el servicio alimentario, el transporte y la construcción, con el fin de examinar cómo afecta a la salud respiratoria la contaminación atmosférica urbana en entornos ocupacionales.
Palabras clave: Entorno Urbano; Operaciones Industriales; Contaminación del Aire Urbano; Salud; Síntomas Respiratorios.
INTRODUCTION
Air pollution is the principal environmental threat associated with urbanization and makes an important contribution to the global epidemic of illness of respiratory and heart-related problems also, it influences the development of the fetus’s brain during gestation.(1) The three primary air pollutants that have the greatest detrimental impacts on human well-being are nitrogen dioxide (NO2), ozone (O3), and fine particulate matter (PM2,5) as it causes severe health issues.(2) These components have a major effect on severe cardiovascular events and acute respiratory events in regular death and hospitalizations.(3) The industry-related air pollution could have an impact on people’s health frequently becomes of significant community problem. Presently there is not much research associating industry-related airborne contaminants to unfavourable outcomes.(4) The control of pollution in the air in commercial environments provides more enhanced health outcomes for the people in the surrounding area.(5) There is the potential for an increasingly noticeable decrease in air pollutants in colder countries which use more coal for winter heating, and the cities that use more energy or cities with larger traffic volumes by implementing government-regulated strategies.(6) Improving health may be accomplished rapidly and significantly through decreasing pollution at its source. A lack of breath, coughing, phlegm, and sore throat are among asthma and irritant problems that resolve completely.(7)
The correlation between morbidity and exposure to various pollutants in a developed region with high levels of pollution in the environment was explored.(8) The information was obtained from municipality registrations, and individuals were tracked until the year 2013. The dispersion model was used to assess permanent exposition to pollutants from traffic (Ox) and industrial exhaust (PM10). Cox analysis of survival was used, taking economic standing, age, and sex into account. The results suggested that while Ox exposure was linked with neurological conditions and malignancy, PM10 had a strong connection with death from unintentional reasons, cancers, and heart illnesses.
A deeper investigation was employed to find economically feasible and pollution-tolerant plants for ecological corridor establishment in urban industrial situations.(9) Three pharmacological and one biological determination were used to assess the air pollution tolerance index (APTI) values of 36 kinds of plants. The two analyses of correlation analysis and cluster analysis were implemented to effectively test the examination. Depending on the results demonstrated that plants were the most effective for lowering air pollution and increasing the sustainability of urban ecosystems, particularly Lagerstroemia speciosa, schleichera oleosa, and thespesia populnea had a positive impact on reducing pollutants in the air.
The effect of urban layout on long-term PM-2,5 trends in 626 cities was performed, with a special focus on smaller and midsized cities, that have experienced the fastest rates of growth in urbanization.(10) The empirical methods explore the impact of urban planning on air quality across a range of community sizes and development levels. Urban measurements and decadal PM2,5 trends were used to gather data. The findings from data panel analysis and analysis of variance (ANOVA) confirm targeted clean air initiatives by showing that spatial connectivity raises PM2,5 in large cities, aggregating measurements predominate in midsized towns, and area criteria affect PM2,5 in smaller towns.
The concentrations of air pollutant components like PM10, PM2,5, NO2, and CO in the manufacturing areas along with their levels of correlation to find weather patterns and respiratory conditions in correlation were analysed in industrial workers and their families as well.(11) Pollution level, as well as health record data, were gathered, and kriging and inverse distance weighted (IDW) techniques for interpolation were employed for modeling. The findings proved that pollutant concentrations varied significantly by season, following an exponential polynomial structure and correlating with the development of businesses. In addition, Spearman’s rho correlation, and respiratory conditions had an adverse relationship with rainfall, temperature, and wind velocity but a beneficial relationship with PM2,5, NO2, and CO.
The detrimental impacts of industrial air pollution on people living close to manufacturing fields are explored in the cross-sectional evaluation, with a concentration on both acute and long-term medical conditions.(12) A well-organized questionnaire was developed to gather the necessary statistics from two distinct groups of people. The geographic information system (GIS) and Google’s earth were used to calculate distances between human beings the commercial environments. Multiple logistic regression showed that the first group had a considerably greater probability of acute irritant problems like eye and throat irritation and chronic respiratory problems including chronic bronchitis, and phlegm, and group 2 had lower seriousness. The results highlighted the crucial importance of moving to safer regions along with taking preventative steps.
The standard of the air, the overall incidence of respiratory diseases in youngsters, and the connection among these factors were analysed in towns and cities with contaminants under national constraints.(13) Throughout a nine-month period, data on PM10, NO2, and O3 concentrations was obtained from five different educational institutions. Interviews with young people were used to collect symptoms of respiration. The ANOVA is implemented to validate the outcomes. As per the findings, the PM10 and NO2 levels were greater than shown to be strongly associated with wider health concerns.
The assessment of air pollution, in the urban environment, and urban heat islands (UHIs) influence on the respiratory conditions in kids in preschool was carried out which encompassing asthma, wheezing, and rhinitis due to allergies.(14) A total quantity of 276 kindergarten-aged children from both urban and rural regions students were participated. Measurements of volatile organic chemicals in inhaled respiration, dermal prick examinations, and caregiving surveys were used to gather statistics. Descriptive statistics were used to estimate the specific characteristics of the participants. The findings are delivered superior to children’s preventative health initiatives in UAP.
The impact of pollution from the outdoors, with a focus on the pandemic, on the propagation and severity of respiratory infections caused by viruses was evaluated.(15) The approach involved examining the respiratory illnesses pollutants PM, nitrogen oxides, sulfur dioxide, carbon monoxide, ozone, volatile organic compounds (VOCs), and polycyclic aromatic hydrocarbons (PAHs). The air pollutant components and respiratory disease virus information are used as the data gathering technique. Higher pollutant levels are linked to worsening respiratory diseases, including more severe health outcomes, based on the findings emphasized the impact of this correlation and the need for the early detection approach.
The effective correlation between respiratory and oxidative stress outcomes and individuals’ exposition to traffic-related air pollutants including benzene, polycyclic aromatic hydrocarbons, and black carbon was examined among urban greenery workers.(16) To quantify absorption and health impacts, data was gathered over four successive days of employment in 2016–2017 using nephelometers, urine biomarkers, and assessments. The findings from one-way ANOVA revealed significant variation among regions in black carbon being exposed, with smokers suffering higher levels of inflammation in their lungs and non-smokers undergoing a greater degree of oxidative stress.
With a particular focus on PM2,5 and PM10, the analysis aims to evaluate possible scenarios for lowering air pollution and related health expenses between the years 2015 to 2017.(17) For the quantitative analysis hospitalizations for cardiorespiratory disorders and the related expenditures were gathered. Short-term strategy reductions in PM10 and PM2,5 could save multiple hospitalizations, based on the data. These results demonstrate the significant economic and psychological benefits that result from reducing air pollution. Overall, the possible health advantages of bringing the levels of pollutants lower than particular thresholds were ultimately achieved.
The purpose of the study is to examine the different respiratory disorders including phlegm, throat irritation, chest discomfort, wheezing, and stuffy nose that are experienced by workers in occupational settings who are exposed to severe air pollution. Additionally, it evaluates the two key indicators of lung function to estimate the health status of the participants.
The rest of the paper is organized section 2 briefly describes the data gathering process, developed inquiries and major pollutant factors for effective analysis, and the validated approaches of statistical analysis technique while section 3 concentrates on the effective findings obtained from the analytical techniques. Section 4 offers a detailed discussion of the overall outcomes and the conclusion is narrated in the final section of section 5.
METHOD
A brief explanation of the key pollutants in urban air pollution (UAP), highlighting their impact on health. Data was collected through a structured questionnaire designed to capture relevant factors. Evaluation variables included environmental, health, and socio-economic data. Statistical analysis, including multiple regression, was narrated below.
Key pollutants in UAP
Urban regions are typically exposed to a variety of air contaminants primarily from the field work of industrial activities, construction work, and traffic emissions. Particulate matter (PM2,5 and PM10), which are very small particles is a significant harmful substance that can penetrate the circulatory system and lungs extensively and cause respiratory and cardiovascular disorders. The nitrogen dioxide (NO2) produced by nuclear power plants and vehicle exhaust, could pollute the respiratory system and also contribute to the formation of polluted air. Acidic precipitation and respiratory conditions can be worsened by sulfur dioxide (SO2), which is primarily generated by production processes and the combustion of fossil fuels. There are serious health concerns associated with these contaminants, especially in crowded metropolitan areas.
Data collection
A total amount of 150 individuals is selected for the evaluation of respiratory health due to the UAP. The necessary demographic features are considered such as male and female, the age which is ranged between 18 to 60 years above. The different occupational types comprised of construction environments, transportation, and food services make it suitable for significant assessment of air pollution rather than the indoor environmental structure. Also, the previously existing respiratory conditions may greatly affect how people react to external variables like dust, air pollution, or chemical exposure in all types of industrial establishments. Since smoking is an associated risk for respiratory diseases, smoking status is frequently included as an essential variable. Table 1 briefly describes the profile of the 150 individuals.
|
Table 1. Participant’s profile for the effective assessment |
||
|
Demographic Characteristics |
Categorization |
Frequency (n) |
|
Gender |
Male |
90 |
|
|
female |
60 |
|
Age in years |
18–29 |
30 |
|
|
29-39 |
45 |
|
|
39-49 |
40 |
|
|
49-59 |
25 |
|
|
Above 60 |
10 |
|
Occupational category |
Food Service |
50 |
|
|
Transportation |
55 |
|
|
Construction |
45 |
|
Smoking status |
smokers |
50 |
|
|
Non smokers |
100 |
|
Pre-existing respiratory conditions |
Yes |
40 |
|
|
No |
110 |
The report assists in identifying shifts and potential risk factors for respiratory health in different population groups. Additionally, it helps determine the data for more accurate analysis and precise outcomes.
Questionnaire design
A structured questionnaire technique was used to collect important information about the primary aspects of respiratory health in occupational settings. The questions are aimed at assessing how various factors, such as lung function and respiratory symptoms influence the health outcomes of employees in food services, construction, and transportation. Table 2 offers the implemented survey questions.
|
Table 2. Designed inquiries for assessing the responses from the participants |
||
|
Respiratory symptoms |
Developed questions |
Evaluating tool |
|
Phlegm |
Do you notice phlegm production after prolonged physical work (e.g., lifting, walking)? |
Five point Likert measurement tool varied between never(1) to always (5) |
|
Does your job involve conditions that may cause your throat to feel congested or blocked? |
||
|
How often do you feel that the phlegm production interferes with your ability to work effectively? |
|
|
|
Throat irritations |
When exposed to certain work environments (e.g., dusty areas), how often do you experience throat irritation? |
|
|
How severe is the throat irritation when you’re working in environments with chemicals or other pollutants? |
|
|
|
Does throat irritation affect your ability to communicate or perform tasks during the workday? |
|
|
|
Chest discomfort |
How often do you experience discomfort in the chest when performing strenuous work activities? |
|
|
Does your chest discomfort affect your ability to complete physical tasks on the job? |
|
|
|
Does chest discomfort increase after long hours or specific work tasks? |
|
|
|
Stuffy nose |
How often do you find yourself with a stuffy nose at work due to environmental conditions (e.g., dust, cold air)? |
|
|
When exposed to particular work environments, how frequently do you experience nasal congestion or difficulty breathing? |
|
|
|
Does nasal congestion make it difficult for you to breathe freely or perform physical tasks at work? |
|
|
|
Wheezing |
How often do you notice wheezing sounds when breathing during or after physical tasks at work? |
|
|
When working in areas with poor air quality (e.g., dusty or polluted environments), how often does wheezing occur? |
|
|
|
Do you feel wheezing limits your physical performance or your ability to carry out tasks effectively? |
|
|
Respondents were prompted to grade their replies on a five-point Likert scale such as initially (1) symbolizing never and 5 offers always. Using the assistance of the tool, the model can determine the degree to which individuals reacted toward every aspect. The statistical tool was applied for assessing responses to the surveys and contributed to understanding the relationships among those variables and how influenced the achievement of students.
Evaluation variables
In monitoring the conditions of the respiratory systems, the significant variables that include forced expiratory volume in 1 second (FEV1) and forced vital capacity (FVC) are taken into consideration. The whole amount of air that is compelled and removed after taking a deep inhale is known as FVC. Decreased capacity for breathing is indicated by a quantity less than 80 % of the expected FVC, which could be caused by restricting lung diseases. The forceful expiration of air in one second is determined by FEV1. Similar to the FVS, when the FEV1 score is decreased than 80 %, it suggests limiting or disruptive lung dysfunction, which affects circulation. To make it possible to identify obstructed lung illnesses like asthma or persistent obstructive pulmonary disease the ratio of FEV1 to FVC is used as a measurement tool. A ratio below 70 % indicates air circulation constraints due to distinct diseases.
The different respiratory conditions encompass a range of symptoms like persistent coughing concern. In addition, it had breathing difficulties like phlegm, discomfort in the chest, stuffy nose, wheezing, and dryness of the throat. These symptoms of respiration are directly influenced by the above-mentioned variables. Reduced capacity for breathing is indicated by a low FEV1 and FVC, which is frequently linked with wheezing and continual coughing. A low FEV1/FVC ratio denotes airflow obstruction, typical in conditions like asthma and COPD, causing breathlessness and chest pain due to inadequate airflow. Reduced lung volumes also impair the clearance of mucus, contributing to phlegm production and throat irritation. These factors increase airway inflammation, making individuals more susceptible to nasal discharge and other upper.
Statistical analysis
The concepts that are necessary for analysing the relationships between the variables and the impacts were assessed using IBM SPSS version 25 in the recommended approach can be obtained from multiple regression models, permitting the notable evaluation of the variables.
To investigate the correlation between the dependent factor, which is the intensity of symptoms related to breathing (e.g., phlegm, throat irritation, chest discomfort, and wheezing), and multiple independent variables of occupational category, a multiple regression technique is employed. Through the discovery of relevant predictors, the investigation will provide further understanding of how various occupational and demographic characteristics contribute to respiratory problems in the context of UAP, offering directions for concentrated procedures. Equation 1 provides the effective calculation of the regression.
x=β0+β0 y0+β1 y1+⋯+ βn yn+e (1)
Where the intensity of respiratory symptoms is determined by the dependent factor x. The constant is mentioned by β0. The coefficients of the autonomous variables are β1, β2… βn. y0, y1,… yn is the dependent variable and e is the error quantity.
RESULTS
The alteration in the variable that is dependent (such as respiratory symptoms) for each unit of variation in the independent factor is expressed by the coefficient (B). The value of the coefficient estimate’s preciseness or unpredictability is determined by the standard error (SE). The relative importance of every factor is evaluated by applying the t-value, which is the ratio of the coefficients to its SE. The statistically significant effect of every variable is shown by the p-value. The variable is regarded as significant in statistics if the p-value is less than 0,05. Confidence interval (CI) provides a range of values that, with 95 % certainty, the actual population’s estimate is most probable to be located in the interior. The regression analysis outcomes of three occupations namely, food service (table 3), transportation (table 4), and construction workers are described in table 5, respectively.
|
Table 3. Regression evaluation of food service employee |
|||||
|
Employed variables |
B |
SE |
t- measure |
p-statistics |
95 % of CI |
|
Constant |
1,50 |
0,30 |
5,00 |
<0,001 |
(0,91, 2,09) |
|
FVC |
-0,22 |
0,10 |
-2,20 |
0,03 |
(-0,42, -0,02) |
|
FEV1 |
-0,15 |
0,08 |
-1,88 |
0,06 |
(-0,31, 0,01) |
|
FEV1/FVC |
-0,18 |
0,12 |
-1,50 |
0,13 |
(-0,42, 0,06) |
|
Frequent cough |
-0,30 |
0,12 |
2,50 |
0,01 |
(0,06, 0,54) |
|
Frequent cough with phlegm |
-0,50 |
0,15 |
3,33 |
0,001 |
(0,21, 0,79) |
|
Throat irritations |
-0,35 |
0,14 |
2,50 |
0,02 |
(0,07, 0,63) |
|
Chest discomfort |
-0,40 |
0,13 |
3,08 |
0,002 |
(0,14, 0,66) |
|
Stuffy nose |
-0,25 |
0,10 |
2,50 |
0,01 |
(0,05, 0,45) |
|
Wheezing |
-0,45 |
0,14 |
3,21 |
0,002 |
(0,17, 0,73) |
The highest t-value (3,33) Frequent cough with phlegm indicates that it has been most closely connected to the result parameter. The constant is highly statistically noteworthy, as demonstrated by its lowest p-value (< 0,001) implies that it played an important part in the model’s baseline forecasting. The highest B (-0,50) is Frequent cough with phlegm. A higher unfavorable correlation indicates that this variable has a substantial impact and makes a major contribution to the undesirable outcome. The smallest SE (0,10) is identified as stuffy noise demonstrated. Figure 1 offered that the prediction is fairly accurate and trustworthy. A strong and significant link is indicated by the fact that the 95 % CIs for several variables including wheezing, chest discomfort, and frequent coughing with phlegm are all below zero.
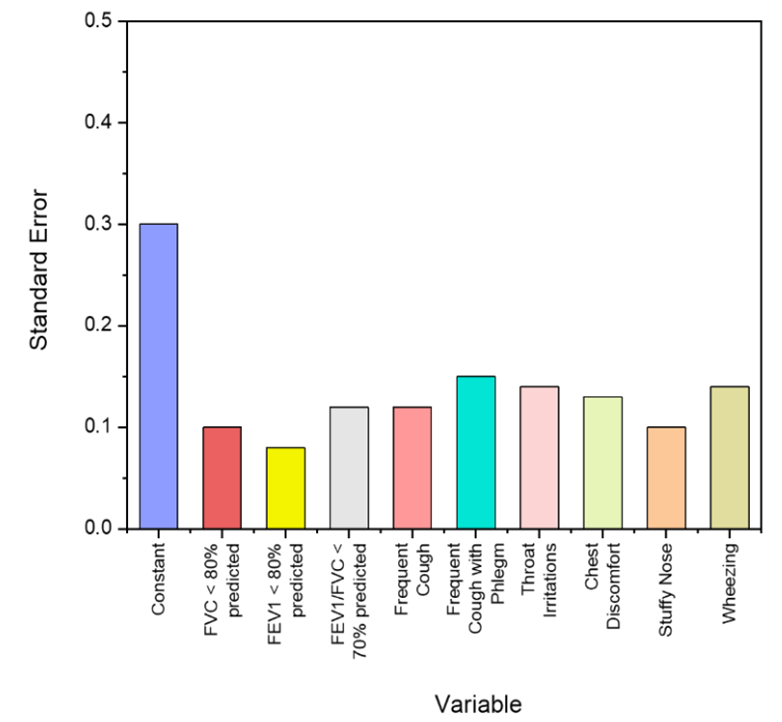
Figure 1. The SE findings of the food service employees
|
Table 4. Transportation employee outcomes using regression analysis |
|||||
|
Employed variables |
B |
SE |
t- measure |
p-statistics |
95 % of CI |
|
Constant |
1,40 |
0,35 |
4,00 |
<0,001 |
(0,70, 2,10) |
|
FVC |
-0,25 |
0,12 |
-2,08 |
0,04 |
(-0,49, -0,01) |
|
FEV1 |
-0,18 |
0,09 |
-2,00 |
0,05 |
(-0,36, 0,00) |
|
FEV1/FVC |
-0,20 |
0,14 |
-1,43 |
0,15 |
(-0,47, 0,07) |
|
Frequent cough |
0,32 |
0,13 |
2,46 |
0,02 |
(0,06, 0,58) |
|
Frequent cough with phlegm |
0,52 |
0,18 |
2,89 |
0,004 |
(0,16, 0,88) |
|
Throat irritations |
0,38 |
0,15 |
2,53 |
0,01 |
(0,08, 0,68) |
|
Chest discomfort |
0,43 |
0,16 |
2,69 |
0,008 |
(0,10, 0,76) |
|
Stuffy nose |
0,27 |
0,11 |
2,45 |
0,02 |
(0,05, 0,49) |
|
Wheezing |
0,47 |
0,17 |
2,76 |
0,007 |
(0,13, 0,81) |
The B value of 0,52, is the maximum for frequent coughing with phlegm which suggests a comparatively higher beneficial influence on the result. With the least SE value of 0,11, a stuffy nose is more reliably predicted as having a positive effect which is, visualized in figure 2. The frequent coughing with phlegm has the greatest statistical correlation as demonstrated by its highest t-statistic of 2,89 and lesser p-value of 0,004. The noteworthy favorable effects (CI) are achieved by Frequent cough with phlegm (0,16, 0,88), wheezing (0,13, 0,81), and Chest discomfort (0,10, 0,76), of 95 % CI.
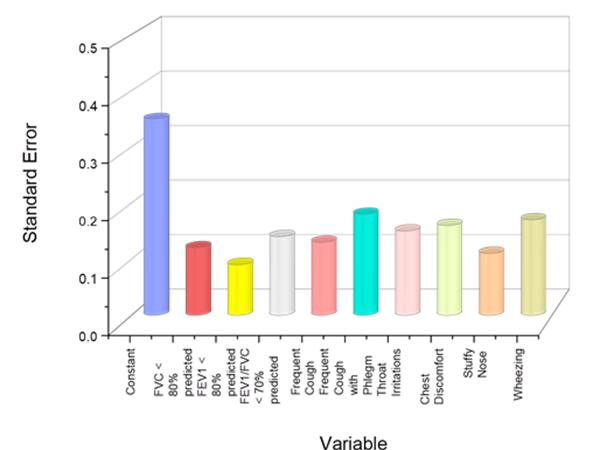
Figure 2. The transportation sector workers’ SE outcomes
|
Table 5. Determinants of individual outcomes in the construction |
|||||
|
Employed variables |
B |
SE |
t- measure |
p-statistics |
95 % of CI |
|
Constant |
1,75 |
0,40 |
4,38 |
<0,001 |
(0,95, 2,55) |
|
FVC |
-0,30 |
0,14 |
-2,14 |
0,03 |
(-0,57, -0,03) |
|
FEV1 |
-0,22 |
0,11 |
-2,00 |
0,05 |
(-0,43, 0,00) |
|
FEV1/FVC |
-0,18 |
0,13 |
-1,38 |
0,17 |
(-0,43, 0,07) |
|
Frequent cough |
0,38 |
0,14 |
2,71 |
0,008 |
(0,10, 0,66) |
|
Frequent cough with phlegm |
0,55 |
0,20 |
2,75 |
0,006 |
(0,15, 0,95) |
|
Throat irritations |
0,40 |
0,16 |
2,51 |
0,02 |
(0,08, 0,72) |
|
Chest discomfort |
0,47 |
0,17 |
2,76 |
0,007 |
(0,12, 0,82) |
|
Stuffy nose |
0,33 |
0,12 |
2,75 |
0,007 |
(0,08, 0,58) |
|
Wheezing |
0,49 |
0,19 |
2,58 |
0,01 |
(0,12, 0,86) |
With the highest B value of 0,55, frequent coughing up phlegm suggests a relatively substantial beneficial impact on the outcome. Having the lowest SE value of 0,12, a stuffy nose is expected to have a more precise impact on that outcome. The variable that has the most significant association with the result is Chest discomfort, as evidenced by its highest t-statistic of 2,76. The frequent coughing up phlegm stands out as having a decreased p measurement of 0,006 delivering an essential helpful contribution. For several variables, including frequent coughing with phlegm (0,15, 0,95), wheezing (0,12, 0,86), and chest discomfort (0,12, 0,82), the 95 % CIs do not include zero, showing consistent and noteworthy favorable advantages. Figure 3 displays the different SE of each varaibles.
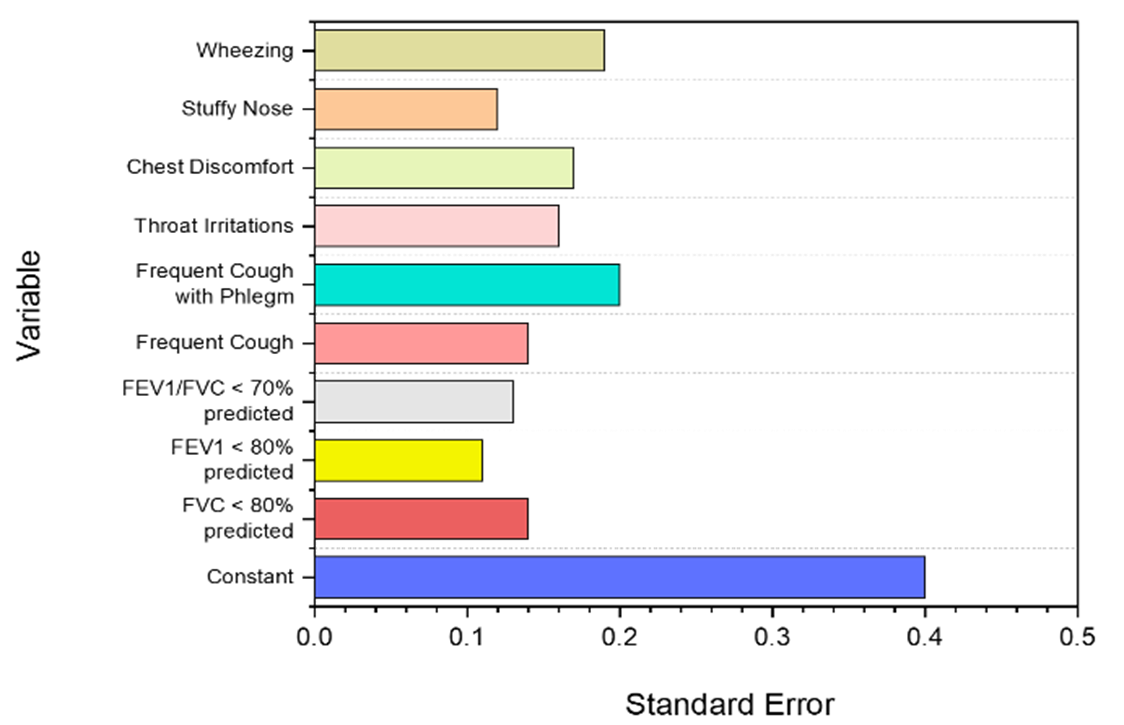
Figure 3. The SE results of the construction employees
DISCUSSION
From the examination of UAP in three occupational categories of food service, transportation, and construction, it was confirmed that the people who are most impacted by pollutants in the air are workers in construction. Although the effects are less apparent, respiratory symptoms including frequent coughing and throat irritations have a modest correlation with being exposed to airborne contaminants in the food service sector. The transportation workers occasionally experience some respiratory distress, especially wheezing and chest discomfort. However, the consequences are not as serious as those seen by construction employees. The construction industries demonstrate the strongest negative correlations with lung function indicators like FVC and FEV1, and severe symptoms, confirming that workers are more adversely affected by air pollution.
CONCLUSIONS
The significant influence of air pollution on different occupational classifications was emphasized in the investigation. A total amount of 150 individuals from the constructions, food services and the transports were incorporated for the analysis consisting of necessary demographics. A structured questionnaire was implemented to gather valid responses from the participants that concentrated on how the different respiratory conditions could impact the different occupational employees. In addition, the major air pollutants in urban regions were identified. The statistical analysis was carried out using IBM SPSS version 30, which included the multiple regression model. The regression model revealed that the significant impact of different respiratory conditions includes chest discomfort, wheezing, stuffy nose, throat irritation, and cough with phlegm in distinct industrial workers. These findings underscored that construction employees are severely impacted by air pollution due to their prolonged exposure to the high concentrations of airborne particles and particulates that are frequently observed on construction premises.
BIBLIOGRAPHIC REFERENCES
1. Sunyer J, Dadvand P. Pre‐natal brain development as a target for urban air pollution. Basic & clinical pharmacology & toxicology. 2019 Aug;125:81-8. https://doi.org/10.1111/bcpt.13226
2. Wei Y, Yazdi MD, Di Q, Requia WJ, Dominici F, Zanobetti A, Schwartz J. Emulating causal dose-response relations between air pollutants and mortality in the Medicare population. Environmental Health. 2021 May 6;20(1):53. https://doi.org/10.1186/s12940-021-00742-x
3. Pothirat C, Chaiwong W, Liwsrisakun C, Bumroongkit C, Deesomchok A, Theerakittikul T, Limsukon A, Tajarernmuang P, Phetsuk N. Acute effects of air pollutants on daily mortality and hospitalizations due to cardiovascular and respiratory diseases. Journal of thoracic disease. 2019 Jul;11(7):3070. doi: 10.21037/jtd.2019.07.37
4. Bergstra AD, Brunekreef B, Burdorf A. The influence of industry-related air pollution on birth outcomes in an industrialized area. Environmental pollution. 2021 Jan 15;269:115741. https://doi.org/10.1016/j.envpol.2020.115741
5. Wang K, Tong Y, Yue T, Gao J, Wang C, Zuo P, Liu J. Measure-specific environmental benefits of air pollution control for coal-fired industrial boilers in China from 2015 to 2017. Environmental Pollution. 2021 Mar 15;273:116470. https://doi.org/10.1016/j.envpol.2021.116470
6. He G, Pan Y, Tanaka T. The short-term impacts of COVID-19 lockdown on urban air pollution in China. Nature sustainability. 2020 Dec;3(12):1005-11 https://doi.org/10.1038/s41893-020-0581-y
7. Schraufnagel DE, Balmes JR, De Matteis S, Hoffman B, Kim WJ, Perez-Padilla R, Rice M, Sood A, Vanker A, Wuebbles DJ. Health benefits of air pollution reduction. Annals of the American Thoracic Society. 2019 Dec;16(12):1478-87. https://doi.org/10.1513/AnnalsATS.201907-538CME
8. Bauleo L, Bucci S, Antonucci C, Sozzi R, Davoli M, Forastiere F, Ancona C. Long-term exposure to air pollutants from multiple sources and mortality in an industrial area: a cohort study. Occupational and Environmental Medicine. 2019 Jan 1;76(1):48-57. doi:10.1136/oemed-2018-105059
9. Banerjee S, Banerjee A, Palit D, Roy P. Assessment of vegetation under air pollution stress in urban industrial area for greenbelt development. International Journal of Environmental Science and Technology. 2019 Oct 1;16(10):5857-70. https://doi.org/10.1007/s13762-018-1963-9
10. Liang L, Gong P. Urban, and air pollution: a multi-city study of long-term effects of urban landscape patterns on air quality trends. Scientific reports. 2020 Oct 29;10(1):18618. https://doi.org/10.1038/s41598-020-74524-9
11. Parveen N, Siddiqui L, Sarif MN, Islam MS, Khanam N, Mohibul S. Industries in Delhi: Air pollution versus respiratory morbidities. Process Safety and Environmental Protection. 2021 Aug 1;152:495-512. https://doi.org/10.1016/j.psep.2021.06.027
12. Bano R, Khayyam U. Industrial air pollution and self-reported respiratory and irritant health effects on adjacent residents: a case study of Islamabad Industrial Estate (IEI). Air Quality, Atmosphere & Health. 2021 Oct;14(10):1709-22. https://doi.org/10.1007/s11869-021-01051-5
13. e Almeida LD, Favaro A, Raimundo-Costa W, Anhê AC, Ferreira DC, Blanes-Vidal V, dos Santos Senhuk AP. Influence of urban forest on traffic air pollution and children respiratory health. Environmental monitoring and assessment. 2020 Mar;192:1-9. https://doi.org/10.1007/s10661-020-8142-4
14. Bobrowska-Korzeniowska M, Jerzyńska J, Polańska K, Kaleta D, Stelmach I, Kunert A, Stelmach W. The effect of air pollution on the respiratory system in preschool children with the contribution of urban heat islands and geographic data–the aim of the study and methodological assumptions. International Journal of Occupational Medicine and Environmental Health. 2021;34(4). DOI: https://doi.org/10.13075/ijomeh.1896.01651
15. Domingo JL, Rovira J. Effects of air pollutants on the transmission and severity of respiratory viral infections. Environmental research. 2020 Aug 1;187:109650. doi: 10.1016/j.envres.2020.109650
16. Guilbert A, De Cremer K, Heene B, Demoury C, Aerts R, Declerck P, Brasseur O, Van Nieuwenhuyse A. Personal exposure to traffic-related air pollutants and relationships with respiratory symptoms and oxidative stress: A pilot cross-sectional study among urban green space workers. Science of the Total Environment. 2019 Feb 1;649:620-8. https://doi.org/10.1016/j.scitotenv.2018.08.3380
17. Rocha CA, Lima JL, Mendonça KV, Marques EV, Zanella ME, Ribeiro JP, Bertoncini BV, Branco VT, Cavalcante RM. Health impact assessment of air pollution in the metropolitan region of Fortaleza, Ceará, Brazil. Atmospheric Environment. 2020 Nov 15;241:117751. https://doi.org/10.1016/j.atmosenv.2020.117751
FINANCING
No financing.
CONFLICT OF INTEREST
The authors declare that there is no conflict of interest.
AUTHORSHIP CONTRIBUTION
Data curation: Banani Jena, Hari Narayan Hota, Jamuna. K.V, Mukesh Sharma.
Methodology: Banani Jena, Hari Narayan Hota, Jamuna. K.V, Mukesh Sharma.
Software: Banani Jena, Hari Narayan Hota, Jamuna. K.V, Mukesh Sharma.
Drafting - original draft: Banani Jena, Hari Narayan Hota, Jamuna. K.V, Mukesh Sharma.
Writing - proofreading and editing: Banani Jena, Hari Narayan Hota, Jamuna. K.V, Mukesh Sharma.