doi: 10.56294/hl2022109
ORIGINAL
The Role of Safety Management Systems in Improving Workplace Health and Organizational Success
El papel de los sistemas de gestión de la seguridad en la mejora de la salud en el trabajo y el éxito de las organizaciones
Sunil Kumar Agrawala1
![]() , Shailly Gupta2
, Shailly Gupta2
![]() , Archana Singh3
, Archana Singh3
![]()
1IMS and SUM Hospital, Siksha ‘O’ Anusandhan (Deemed to be University), Department of Surgical Oncology. Bhubaneswar, India.
2Arya College of Pharmacy. Jaipur, India.
3Noida International University, Department of Agriculture. Greater Noida, India.
Cite as: Agrawala SK, Gupta S, Singh A. The Role of Safety Management Systems in Improving Workplace Health and Organizational Success. Health Leadership and Quality of Life. 2022; 1:109. https://doi.org/10.56294/hl2022109
Submitted: 07-08-2022 Revised: 25-10-2022 Accepted: 11-12-2022 Published: 12-12-2022
Editor: PhD.
Prof. Neela Satheesh ![]()
ABSTRACT
Introduction: organizational initiatives aimed at improving workplace performance and safety currently includes the deployment of Safety Management Systems (SMS). SMS includes structured policies, procedures, and tools aimed at improving safety outcomes and reducing risks.
Objetive: to investigate the effects of SMS on key workplace outcomes is the main aim of this research, including workplace health, safety culture, employee productivity, organizational financial performance, employee retention and satisfaction. The research also seeks to identify how safety culture mediates the relationship between SMS and these outcomes.
Method: data from 1028 participants were analyzed using various statistical techniques in AMOS software. The methods included correlation analysis to assess relationships between variables, chi-square test for categorical comparisons, multiple linear regressions to model the direct effects of SMS on dependent variables, and ANOVA for group comparisons based on SMS implementation levels. Structural Equation Modeling (SEM) was used to test complex relationships, including indirect effects mediated by safety culture.
Results: findings indicate that SMS implementation significantly improves workplace health, employee productivity, and organizational financial performance. Organizations with higher SMS maturity report better safety records, increased employee satisfaction, and improved financial performance.
Conclusions: the results underscore the importance of SMS in fostering a safer, more productive workplace. A strong SMS not only enhances workplace safety but also contributes to overall organizational success by improving employee well-being, retention, productivity and financial outcomes.
Keywords: Safety Management Systems; Workplace Health; Safety Culture; Employee Productivity; Organizational Success; Structural Equation Modeling (SEM).
RESUMEN
Introducción: las iniciativas organizativas destinadas a mejorar el rendimiento y la seguridad en el lugar de trabajo incluyen actualmente la implantación de Sistemas de Gestión de la Seguridad (SMS). Los SMS incluyen políticas, procedimientos y herramientas estructurados destinados a mejorar los resultados en materia de seguridad y reducir los riesgos.
Objetivo: investigar los efectos de los SGS en los resultados clave del lugar de trabajo es el principal objetivo de esta investigación, incluyendo la salud en el lugar de trabajo, la cultura de la seguridad, la productividad de los empleados, el rendimiento financiero de la organización, la retención y la satisfacción de los empleados. La investigación también pretende identificar cómo la cultura de la seguridad media en la relación entre los SMS y estos resultados.
Método: los datos de 1028 participantes se analizaron mediante diversas técnicas estadísticas en el programa AMOS. Los métodos incluyeron análisis de correlación para evaluar las relaciones entre variables, pruebas de chi-cuadrado para comparaciones categóricas, regresiones lineales múltiples para modelar los efectos directos de los SMS sobre las variables dependientes y ANOVA para comparaciones de grupos basadas en los niveles de implantación de los SMS. Se utilizó el modelo de ecuaciones estructurales (SEM) para probar relaciones complejas, incluidos los efectos indirectos mediados por la cultura de seguridad.
Resultados: los resultados indican que la implantación de los SGS mejora significativamente la salud en el trabajo, la productividad de los empleados y los resultados financieros de la organización. Las organizaciones con una mayor madurez en SMS presentan mejores registros de seguridad, mayor satisfacción de los empleados y mejores resultados financieros.
Conclusiones: los resultados subrayan la importancia de los SGS para fomentar un lugar de trabajo más seguro y productivo. Un SGS sólido no sólo mejora la seguridad en el lugar de trabajo, sino que también contribuye al éxito general de la organización al mejorar el bienestar, la retención, la productividad y los resultados financieros de los empleados.
Palabras clave: Sistemas de Gestión de la Seguridad; Salud en el Lugar de Trabajo; Cultura de Seguridad; Productividad de los Empleados; Éxito Organizativo; Modelización de Ecuaciones Estructurales (SEM).
INTRODUCTION
A safety management system (SMS) is often regarded as a tool designed and implemented to improve safety performance. However, the successful implementation of an SMS depends not only on its design but also on the people involved. The effectiveness of an SMS relies heavily on those responsible for establishing company policies and allocating resources. Therefore, fostering a strong safety culture within the organization is crucial for enhancing security outcomes alongside the implementation of SMS.(1) Organizations’ SMS are designed to identify preventable risks, and continuously monitor and address potential or actual harm. These systems consist of key components such as, policy, organization, planning, execution, assessment and continuous improvement. The foundation of these systems is based on understanding complex interactions between people and variant agents can lead to risk and harm.(2) SMS aimed to identify the key pillars and trade-offs are most prevalent in the operations of Polish businesses, in which both large and small were legally required to implement SMS. In response to contemporary management concepts, which heavily focused on productivity, efficiency, and effectiveness, proven inadequate during disruptions, resilience was also integrated into safety management.(3)
As the digital revolution accelerates the integration of information technologies into home, it enhances safety, comfort, and energy efficiency concerns. In the development of smart living environment incorporating interaction, monitoring and automation of SMS can provide the capability to perform integrated sensory analysis. This integration ensures safety consideration for individuals.(4)
The growing quantity and complexity of processing facilities and operations in the process sector have accelerated in response to the rising global energy consumption. These advancements have increased exposure to higher levels of risk, necessitating immediate action to ensure safety and mitigate potential hazards. Process safety failures can lead to consequences, including the loss of lives, environmental damage, property destruction, legal action, harm to the company reputation, and substantial financial losses.(5)
Hospitals remain focused on ensuring patient safety. Despite extensive efforts to provide safe care, patients yet experience adverse events during treatment. Medical professionals have worked extensively to enhance the safety of both patients and clinic staff. Hospital administrators have encouraged clinical staff to actively engage in safety management protocols as a key aspect of these initiatives. In addition to developing and implementing safety management protocols, standards, and training programs, administrator have also promoted the adoption of safety practices from other industries that prioritize safety. This ensures a comprehensive approach to risk management.(6) Figure 1 shows the factors of the safety management system.
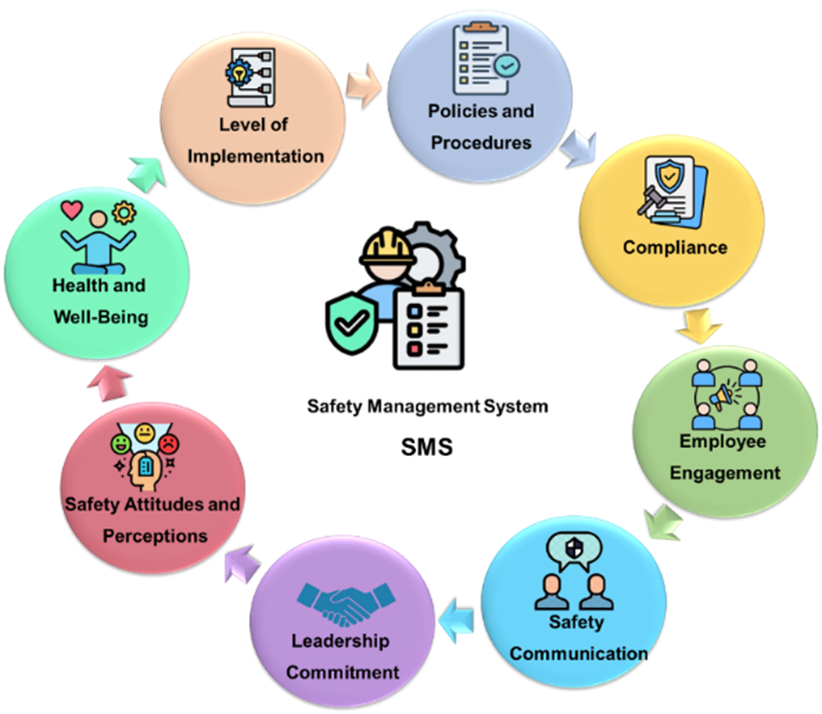
Figure 1. Conceptual framework for SMS introduction
Research objective
The research aims to examine the impact of SMS, on various work place outcomes, including workplace health (WH), safety culture (SC), employee productivity (EP), organizational financial performance (OFP), employee retention (RE) and employee satisfaction (ES). Additionally, the investigation explores how safety mediates relationship between SMS implementation and these key workplace outcomes.
Related works
A framework that enabled effective comparison when selecting a process safety management (PSM) system tailored to the specific needs of an organization was developed.(7) It examined the theoretical functions and industrial application of 21 PSM systems. The integrated process safety management system (IPSMS) model was almost reliable for ensuring comprehensive process safety; it was thought to be the most dependable for guaranteeing thorough process safety. The analysis focused on only one model, which left out important details of various industry demands.
The investigation focused on accidents, the economy, legislation, society, healthcare, and macro governance in industrialized countries. (8) the most commonly applied model for comparing governance structures in nations was multiple differential governance. While engaging in multiple fostering interactions, these nations have diverse administrative system and framework. It was recommended that adopting a government led, multi subject collaborative management method with low cost improved its control over the health and safety of workers. The research only focused on developed nations, limiting its applicability to developing countries with different economic and governance structures.
The analysis employed fuzzy cognitive mapping (FCM) to assess the efficacy of the process within the occupational safety and health management system (OSH MS).(9) A total of 16 items were created for the model, 15 of which represented different system operations and one of which represented safety performance. Simulations demonstrated that the effectiveness of leadership significantly improved safety performance, and suggested that the FCM enhanced the effectiveness of OSHMS. FCM simulations, while useful for modeling complex systems, may oversimplify dynamics by not accounting for all variables and interdependencies.
Almost, 155 responses across two companies were involved, to explore the relationship between senior executive safety management methods and safety behavior. (10) The findings revealed that safety version positively influenced involvement, while safety concern possessed favorable impact on compliance. Additionally, individuality indirectly affected safety behavior. To enhance the safety performance, the report recommended taking steps to strengthen leadership in safety within organizations. It included fostering the culture of accountability and ensuring the safety leadership integrated into every level of organizations. Small sample size of 155 responses from only two organizations limited its generalizability to other industries. To examine the relationship between safety culture and organizational management characteristics within the colligative aviation program and access the influence of management practices and policies was the objective. (11) Quantitative analysis was conducted. The analysis focused on key organizational management characteristics and resilient safety culture within the collegiate aviation program. The research should find the reliability and construct validity in the measurements. The focus was limited to undergraduate aviation schools, and the cross-sectional nature made it difficult to capture informal interactions.
The effectiveness of process safety management (PSM) in the organizational sectors was examined. (12) It utilized publicly accessible PSM performance statistics from the previous 25 years. The findings indicated that while PSM processes have become more advanced, certain underlying causes of incidents, such as system failures, human error posed significant challenges. The research identified critical gaps in the PSM programs. The research was solely based on the publicly accessible data, which may not fully represent the true scope of PSM internal working of organizations.
The investigation on how proactive safety practices affect small company hazard identification, safety management, and procedures in all small companies was done. (13) Quantitative analysis was conducted to collect data from small industries, statical methods, such as SEM to analyze the relationship between the variables. The result indicated the positive relationship between proactive occupational safety strategies (POSS), proactive occupational safety factor (POSF) and productive safety behavior, leading to improved safety management. The model was limited by cross sectional design, which restricted the ability to infer causality between the variables.
To determine the most important elements impacting SMS, an analysis was performed by analyzing the risks associated with energy investments and SMS using a hybrid interval-valued intuitionistic fuzzy (IVIF) decision technique. (14) The IVIF approach was applied to handle uncertainties in decision making process. The findings revealed that the hybrid decision making process provided logical and reliable outcome for prioritizing SMS components and managing risks. The reliance on the judgement of decision making introduced bias into ranking and weighting process.
The identification and mitigation of occupational health and safety hazards was the main goal to evaluate the effect of workplace hazards on safety in small enterprises. (15) The research utilized direct interview and propagator questionnaires to collect data from employees in small organizations. The results were compared with the data from European agency for safety and health at work to evaluate and identify the psychophysical risk in organizations. The finding demonstrated that physical and psychophysical variables were the primary occupational hazards in small organizations. The research limits reliance on self-reported data from interviews and questionnaires, which may lead to inaccuracies.
The differences between behavioral safety, participatory ergonomics, and important participatory safety management techniques were explored. (16) It provided a comprehensive understanding of safety management through participation. Participatory ergonomics and behavioral safety were examined using a qualitative method. The analysis revealed that both variables share the common principles, including worker involvement, continuous improvement, and proactive risk management. The integration offered the more holistic approach to safety management by aligning human behavior and ergonomic design. It primarily relied on secondary sources, which limited the scope of perspective.
METHOD
The present investigation involved analyzing data from 1028 participants using AMOS software. The variables considered included workplace health (WH), safety culture (SC), employee productivity (EP), organizational financial performance (OFP), employee retention (RE) and employee satisfaction (ES). To assess the impact of the SMS on these various workplace outcomes, a combination of statistical techniques was effectively utilized, including multiple linear regression models, ANOVA, chi-square test, and SEM analysis. The analyses were conducted to assess the relationship between SMS and the identified workplace variables.
Hypothesis development
The development of hypothesis in the research focuses on exploring the direct effects of SMS on workplace outcomes such as health, productivity and financial performance. The hypotheses used in the research are as follows:
H1: Workplace health (WH) has a direct positive impact on employee retention (ER).
H2: Safety culture (SC) positively influences employee retention (ER) through its impact on employee satisfaction (ES).
H3: Employee productivity (EP) positively impacts organizational financial performance (OFP).
H4: Employee satisfaction (ES) mediates the relationship between workplace health (WH) and employee retention (ER).
H5: Safety culture (SC) enhances organizational financial performance (OFP) by improving employee productivity (EP).
H6: The relationship between employee productivity (EP) and organizational financial performance (OFP) is moderated by employee satisfaction (ES).
H7: Workplace health (WH) positively influences employee retention (ER), with employee satisfaction (ES) acting as a mediator. Figure 2 shows the conceptual framework of the developed hypotheses.
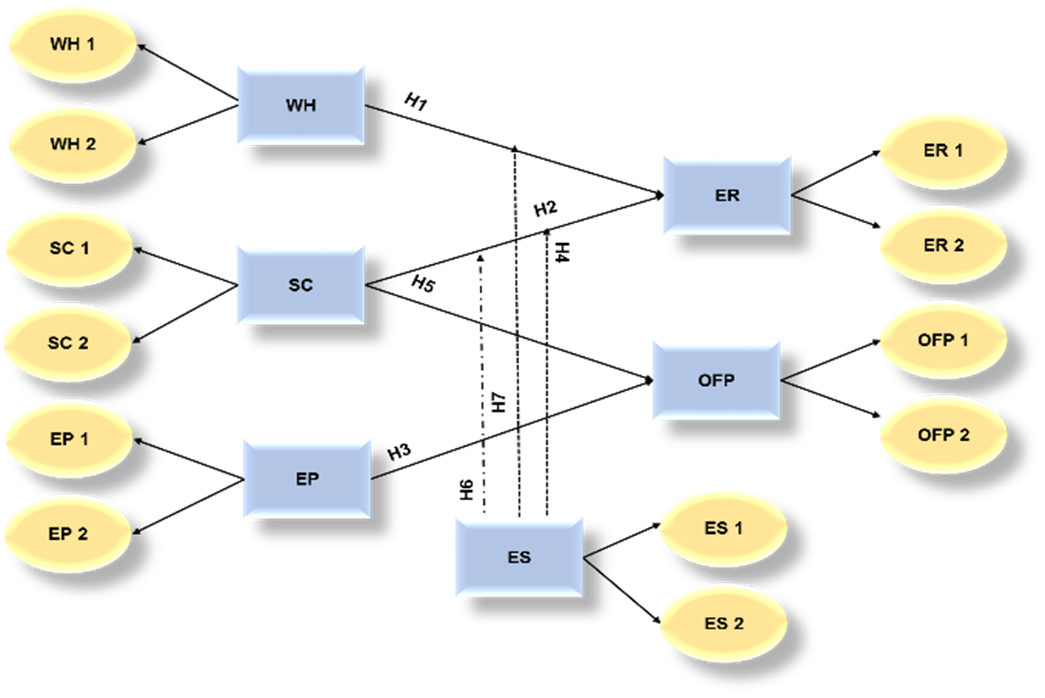
Figure 2. Conceptual framework for hypothesis
Variables
Certain variables are used to analyze the relationship between SMS and the identified workplace variables. The description for each variable is represented in table 1.
|
Table 1. Description of key variables in SMS |
|
|
Variables |
Definition |
|
SC |
The shared values, beliefs, and attitudes towards safety within an organization, influencing behavior and decision-making. |
|
WH |
The overall state of physical and mental strength in the workplace, including the frequency of, illnesses, and near-misses. |
|
EP |
The impact of safety systems on employees’ work performance, efficiency, and output. |
|
OFP |
The effect of SMS implementation on financial outcomes such as cost savings, profitability, and return on investment. |
|
ER |
The impact of SMS on employee job satisfaction, morale, and retention rates. |
|
ES |
The overall continent of employee with their work environment, job roles, compensation, and work place safety measures. |
Data collection
Data were collected from 1028 participants focusing on various demographic factors including age, gender, education level, occupation, safety management experience, occupation, work place size, and SMS implementation. The participants’ demographic information is presented in table 2.
|
Table 2. Demographic details of the participants |
||
|
Demographic Variable |
Category |
Frequency (n=1028) |
|
Age |
18–24 years |
210 |
|
25–34 years |
305 |
|
|
35–44 years |
250 |
|
|
45–54 years |
175 |
|
|
55 years and above |
88 |
|
|
Gender |
Male |
540 |
|
Female |
488 |
|
|
Educational Level |
High School or Below |
175 |
|
Bachelor’s Degree |
526 |
|
|
Master’s Degree |
220 |
|
|
Doctoral Degree |
107 |
|
|
Occupation |
Employee (full-time) |
688 |
|
Employee (part-time) |
150 |
|
|
Self-employed |
85 |
|
|
Student |
105 |
|
|
Safety Management Experience |
No Experience |
263 |
|
Basic Experience |
374 |
|
|
Advanced Experience |
391 |
|
|
Workplace Size |
Small (<50 employees) |
220 |
|
Medium (50–249 employees) |
428 |
|
|
Large (250+ employees) |
380 |
|
|
SMS Implementation Level |
Low |
273 |
|
Moderate |
432 |
|
|
High |
323 |
|
Questionnaires
The questions used in the analysis were designed to collect data on how SMS is improving workplace health and organizational success. Table 3 shows the variables-based questionnaires.
|
Table 3. Questionaries’ for key variables |
|
|
Variables |
Questions |
|
WH |
WH1: How would you rate the overall health conditions at your workplace? |
|
WH2: Do you have access to health-related resources (e.g., wellness programs)? |
|
|
SC |
SC1: How would you rate the safety culture at your workplace? |
|
SC2: Are safety policies and procedures clearly communicated? |
|
|
EP |
EP1: How often do you feel productive at work? |
|
EP2: Do safety concerns affect your productivity? |
|
|
OFP |
OFP1: How do you perceive the financial stability of your organization? |
|
OFP2: Has SMS implementation led to cost savings or financial improvements? |
|
|
ER |
ER1: How likely are you to stay at your current organization in the next year? |
|
ER2: Do you feel your workplace safety influences your decision to stay? |
|
|
ES |
ES1: How satisfied are you with your current job? |
|
ES 2: Does a strong safety culture increase your job satisfaction? |
|
A Likert scale is an analytical instrument frequently used in research to measure attitudes, opinions, or perceptions. It evaluates participants’ perceptions of the SMS on workplace outcomes. Likert scale is commonly employed to measure factors such as safety culture, employee satisfaction, and SMS effectiveness. Strongly disagree to strongly agree responses are scored on a five-point Likert scale.
Statistical Tools
The research employs AMOS software and SEM to analyze the relationship among SMS, EP, SC and organizational outcomes. SEM enables the assessment of both direct and indirect effect between the variables. Multiple linear regression analysis explores the direct effect of SMS on key workplace variables, while Analysis of Variance (ANOVA) is applied to compare group difference based on SMS implementation level. The analysis validates the model’s offering insight into SMS impact on productivity and performance.
· ANOVA is used to assess the impact of SMS on various organizational outcomes, specifically comparing the variables across the different level of SMS implementation. ANOVA allows the comparison of these to determine whether significant differences exist in the workplace outcomes.
· Multiple linear regressions is the statistical technique used for analyzing the connection between several autonomous variables and a dependent variable. Simulating and measuring the independent factors influencing the dependent variable is its primary objective. Regression analysis is essential for data-driven decision-making because it can be used to forecast results, spot trends, and assess the type and strength of correlations.
· SEM analysis is a method used for analyzing the direct and indirect interactions between variables. By enabling this path analysis, researchers assess intricate causal pathways and moderating effects. It illustrates how variables affect one another by using path diagrams to graphically depict the interactions between independent, dependent, and mediating factors. Path analysis offers a more profound understanding of the mechanisms behind observed occurrences by examining multiple interactions at once.
· Correlation analysis is the statistical analysis that is used to discover if there is a relationship between the variables, and provide the strong relationship among the variables. Essentially, correlation analysis is used for spotting pattern. An optimistic correlation results in both variable increases in relation to each other, while an adverse correlation means that as one variable decreases, the other increases.
· Chi-square is used to assess if categorical variables significantly correlate with one another. It contrasts the actual frequency of an event with the frequency predicted by a particular hypothesis. A significant difference is shown by a chi-square value, whereas no relationship is suggested by a low value.
RESULTS AND DISCUSSION
This part highlights response recordings and illustrations while presenting the analysis results using quantitative and structural models. The ANOVA analysis for a number variable is displayed in table 4.
ANOVA
|
Table 4. ANOVA for variable across SMS levels |
||||||
|
Source of Variation |
Variables |
SS |
DF |
MS |
F |
p-value |
|
Between Groups (SMS Levels) |
WH |
350,4 |
4 |
87,6 |
5,21 |
0,003 |
|
SC |
400,1 |
4 |
100,03 |
6,01 |
0,002 |
|
|
EP |
250,7 |
4 |
62,67 |
3,79 |
0,015 |
|
|
OFP |
300,5 |
4 |
75,13 |
4,34 |
0,008 |
|
|
ER |
220,8 |
4 |
55,2 |
3,51 |
0,020 |
|
|
ES |
275,3 |
4 |
68,83 |
4,58 |
0,006 |
|
|
Within Groups (Error) |
All Variables |
1800,9 |
1023 |
1,76 |
- |
- |
|
Total |
All Variables |
2151,8 |
1027 |
- |
- |
- |
The Sum of Squares (SS) measures the variance within and across groups. The number of independent observations is indicated by the Degrees of Freedom (DF). The calculation of Mean Square (MS) involves dividing sum of square (SS) by DF. The p-value evaluates the reliability of the statistic, and the F-Statistic (F) calculates the ratio of variability within a group to between-group variability. Every variable has results that are significant (p-value < 0,05), signifying that there are substantial differences between groups for each variable.
Multiple linear regression
The results obtained by implementing multiple regression analysis are portrayed in table 5.
|
Table 5. Outcomes of regression analysis in predicting the impact of variables |
|||||
|
Variables |
B |
β |
SE |
t-value |
p-value |
|
WH |
0,45 |
0,31 |
0,08 |
5,63 |
0,001 |
|
SC |
0,32 |
0,27 |
0,07 |
4,57 |
0,0003 |
|
EP |
0,56 |
0,41 |
0,09 |
6,22 |
0,001 |
|
OFP |
0,28 |
0,21 |
0,06 |
4,67 |
0,002 |
|
ER |
0,39 |
0,33 |
0,07 |
5,57 |
0,0001 |
|
ES |
0,51 |
0,43 |
0,08 |
6,38 |
0,0001 |
|
Constant (Intercept) |
1,12 |
- |
0,21 |
5,33 |
0,002 |
For every unit change in each independent variable, the individualized coefficients (B) display the change in the variable that is dependent. Each predictor’s strength in comparison is represented by its standardization coefficient (β). The t-value and p-value assess each coefficient’s significance, while the standard error (SE) indicates how accurate the coefficients are. With the greatest standardized coefficient (β = 0,41) for employee productivity (EP), all variables exhibit significant associations (p-value< 0,001). Table 6 shows the correlation analysis for the variables and figure 3 represents the correlation matrix.
|
Table 6. Correlation Analysis for SMS |
||||||
|
Variables |
WH |
SC |
EP |
OFP |
ER |
ES |
|
WH |
1,00 |
0,45 |
0,62 |
0,38 |
0,56 |
0,70 |
|
SC |
0,45 |
1,00 |
0,49 |
0,52 |
0,63 |
0,76 |
|
EP |
0,62 |
0,49 |
1,00 |
0,72 |
0,65 |
0,80 |
|
OFP |
0,38 |
0,52 |
0,72 |
1,00 |
0,54 |
0,70 |
|
ER |
0,56 |
0,63 |
0,65 |
0,54 |
1,00 |
0,78 |
|
ES |
0,70 |
0,76 |
0,80 |
0,70 |
0,78 |
1,00 |
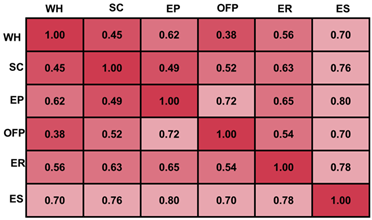
Figure 3. Correlation analysis for SMS key variables
Since all of the diagonal values are 1, there is complete connection between them. Off-diagonal values, which range from 0,38 to 0,80, indicate moderate to strong positive correlations. These values show the direction and intensity of associations between pairs of variables. ES and SC (0,76) and EP and ES (0,80) have the strongest connections.
Measurement model fit
In a structural equation model, a measurement model establishes the connection between latent constructs (factors) and measured variables (indicators). Factor loadings, which indicate the magnitude of the correlations, are commonly included in this model. It is crucial to guaranteeing the dependability and validity of the constructions being assessed. CR is the composite reliability and average variance reliability is called AVE. Table 7 exhibits validity and reliability data. In addition, Figure 4 shows the measurement model efficiency.
|
Table 7. Reliability and validity statistics for measurement construct and indicators |
|||||
|
Variables |
Indicator |
α |
Factor Loading |
CR |
AVE |
|
WH |
WH1 |
0,82 |
0,78 |
0,86 |
0,72 |
|
WH2 |
|
0,82 |
|
|
|
|
SC |
SC1 |
0,83 |
0,85 |
0,88 |
0,74 |
|
SC2 |
|
0,80 |
|
|
|
|
EP |
EP1 |
0,80 |
0,84 |
0,89 |
0,75 |
|
EP2 |
|
0,79 |
|
|
|
|
OFP |
OFP1 |
0,79 |
0,77 |
0,84 |
0,70 |
|
OFP2 |
|
0,80 |
|
|
|
|
ER |
ER1 |
0,81 |
0,83 |
0,87 |
0,73 |
|
ER2 |
|
0,79 |
|
|
|
|
ES |
ES1 |
0,85 |
0,86 |
0,90 |
0,76 |
|
ES2 |
|
0,84 |
|
|
|

Figure 4. Measurement model evaluation for the construct SMS variables
Strong internal consistency is indicated by α values that are higher than the permissible cutoff of 0,7. Good indicator quality is indicated by factor loadings greater than 0,75. The robustness of the measures is ensured by CR values more than 0,80, which validate construct accuracy and validate convergent validity.
Path Analysis
The outcomes obtained for hypothesis testing is represented in Table 8. Furthermore, the modelling of path analysis is shown in figure 5.
|
Table 8. Statistical results for path analysis |
||||||
|
Hypothesis |
Coefficient of Path |
t-value |
p-value |
R² |
Standard Error (SE) |
Result |
|
H1: WH → ER |
0,45 |
6,32 |
< 0,001 |
0,62 |
0,070 |
Well-Supported |
|
H2: SC → ER |
0,38 |
5,15 |
< 0,001 |
0,58 |
0,065 |
Well-Supported |
|
H3: EP → OFP |
0,50 |
7,45 |
< 0,001 |
0,67 |
0,060 |
Well-Supported |
|
H4: ES mediate WH→ER |
0,42 |
5,70 |
< 0,001 |
0,61 |
0,072 |
Well-Supported |
|
H5: ES → ER |
0,37 |
5,09 |
< 0,001 |
0,59 |
0,075 |
Well-Supported |
|
H6: SC → OFP moderated by EP |
0,33 |
4,88 |
< 0,001 |
0,55 |
0,079 |
Supported |
|
H7: WH → ER mediated by ES |
0,40 |
5,32 |
< 0,001 |
0,60 |
0,078 |
Well-Supported |

Figure 5. Illustration model for path analysis
The path coefficient, t-value, p-value, R² standard error (SE), and the hypothesis’s level of support are all included in each hypothesis. With high R² values suggesting excellent model fit, all hypotheses exhibit statistically significant results (p-value < 0,001), and most are categorized as “Well-Supported,” with the exception of H6, which is supported.
Chi-square
The chi-square test results for the different identified variables are shown in table 9.
|
Table 9. Chi-square test outcomes for the variables |
||||
|
Hypothesis |
Chi-Square Value (x²) |
Degrees of Freedom (DF) |
p-value |
Significance Level |
|
WH |
12,34 |
3 |
0,004 |
Significant |
|
SC |
10,56 |
3 |
0,012 |
Significant |
|
EP |
15,78 |
4 |
0,001 |
Significant |
|
OFP |
9,23 |
3 |
0,026 |
Significant |
|
ER |
11,89 |
3 |
0,008 |
Significant |
|
ES |
14,56 |
4 |
0,003 |
Significant |
The link between observed and predicted frequencies is tested using the chi-square values (x²). DF represents the number of independent categories. P value indicates statically significance, and all hypothesis show significant results ( value < 0,05), confirming that the relationship tested are meaningful at the significance level.
DISCUSSION
This section discusses the findings, providing a better understanding of the relationship between key factors. ANOVA analysis reveals the significant differences, indicating variability across the variables. All of the coefficients in multiple linear regressions are statistically significant, demonstrating the predictors’ substantial influence on the dependent variable. The results of correlation analysis show that there are moderate to strong positive associations between the variables, with some pairs exhibiting the highest correlations. These strong correlations are confirmed by SEM analysis, which demonstrated high model fit and robust route coefficient. Finally, the chi-square test validates the relationships and reaffirms the importance of these interactions.
CONCLUSIONS
The impact of SMS on key workplace outcomes was analyzed, including workplace health, safety culture, employee productivity, employee retention and employee satisfaction. Using data from 1028 participants and employing statistical techniques such as correlation analysis, chi-square tests, multiple regression analysis and SEM, the results showed that SMS implementation significantly improved safety and productivity outcomes. Further, the research highlighted that safety culture mediated the relationship between SMS and these outcomes. Organizations with higher SMS reported better safety records, increased employee satisfaction, and enhanced financial performance. The resilience on cross-sectional data may limit the ability to observe long term effects. Future research could explore the sustained impact of SMS over time and across different organizational contexts.
BIBLIOGRAPHIC REFERENCES
1. Kim NK, Rahim NF, Iranmanesh M, Foroughi B. The role of the safety climate in the successful implementation of safety management systems. Safety science. 2019 Oct 1;118:48-56. DOI: https://doi.org/10.1016/j.ssci.2019.05.008
2. Sepúlveda MJ. Integrating information technologies safety into occupational and environmental safety management systems. Journal of occupational and environmental medicine. 2019 Jun 1;61(6):e297-9. DOI: 10.1097/JOM.0000000000001572
3. Pęciłło M. Identification of gaps in safety management systems from the resilience engineering perspective in upper and lower-tier enterprises. Safety Science. 2020 Oct 1;130:104851. DOI: https://doi.org/10.1016/j.ssci.2020.104851
4. Liu Z, Zhang A, Wang W. A framework for an indoor safety management system based on digital twin. Sensors. 2020 Oct 12;20(20):5771. DOI: https://doi.org/10.3390/s20205771
5. Nwankwo CD, Theophilus SC, Arewa AO. A comparative analysis of process safety management (PSM) systems in the process industry. Journal of Loss Prevention in the Process Industries. 2020 Jul 1;66:104171. DOI: https://dx.doi.org/10.1016/j.jlp.2020.104171
6. Kaya GK, Hocaoglu MF. Semi-quantitative application to the Functional Resonance Analysis Method for supporting safety management in a complex health-care process. Reliability Engineering & System Safety. 2020 Oct 1;202:106970. DOI: https://doi.org/10.1016/j.ress.2020.106970
7. Nwankwo CD, Theophilus SC, Arewa AO. A comparative analysis of process safety management (PSM) systems in the process industry. Journal of Loss Prevention in the Process Industries. 2020 Jul 1;66:104171. DOI: https://dx.doi.org/10.1016/j.jlp.2020.104171
8. Chen H, Hou C, Zhang L, Li S. Comparative study on the strands of research on the governance model of international occupational safety and health issues. Safety science. 2020 Feb 1;122:104513. DOI: https://doi.org/10.1016/j.ssci.2019.104513
9. Skład A. Assessing the impact of processes on the Occupational Safety and Health Management System’s effectiveness using the fuzzy cognitive maps approach. Safety science. 2019 Aug 1;117:71-80. DOI: https://doi.org/10.1016/j.ssci.2019.03.021
10. Xue Y, Fan Y, Xie X. Relation between senior managers’ safety leadership and safety behavior in the Chinese petrochemical industry. Journal of Loss Prevention in the Process Industries. 2020 May 1;65:104142. DOI: https://doi.org/10.1016/j.jlp.2020.104142
11. Adjekum DK, Tous MF. Assessing the relationship between organizational management factors and a resilient safety culture in a collegiate aviation program with Safety Management Systems (SMS). Safety science. 2020 Nov 1;131:104909. DOI: https://doi.org/10.1016/j.ssci.2020.104909
12. Behie SW, Halim SZ, Efaw B, O’Connor TM, Quddus N. Guidance to improve the effectiveness of process safety management systems in operating facilities. Journal of loss prevention in the process industries. 2020 Nov 1;68:104257. DOI: https://doi.org/10.1016/j.jlp.2020.104257
13. Mei Q, Wang Q, Liu S, Zhou Q, Zhang J. Effects of organizational safety on employees’ proactivity safety behaviors and occupational health and safety management systems in Chinese high-risk small-scale enterprises. International Journal of Occupational Safety and Ergonomics. 2020 Jan 2;26(1):101-11. DOI: https://doi.org/10.1080/10803548.2018.1470287
14. Fang S, Zhou P, Dinçer H, Yüksel S. Assessment of safety management system on energy investment risk using house of quality based on hybrid stochastic interval-valued intuitionistic fuzzy decision-making approach. Safety Science. 2021 Sep 1;141:105333. DOI: https://doi.org/10.1016/j.ssci.2021.105333
15. Niciejewska M, Kiriliuk O. Occupational health and safety management in “small size” enterprises, with particular emphasis on hazards identification. Production Engineering Archives. 2020 Dec 1;26(4):195-201. DOI: https://doi.org/10.30657/pea.2020.26.34
16. Rost KA, Alvero AM. Participatory approaches to workplace safety management: bridging the gap between behavioral safety and participatory ergonomics. International journal of occupational safety and ergonomics. 2020 Jan 2. DOI: https://doi.org/10.1080/10803548.2018.1438221
FINANCING
None.
CONFLICT OF INTEREST
None.
AUTHORSHIP CONTRIBUTION
Conceptualization: Sunil Kumar Agrawala, Shailly Gupta, Archana Singh.
Data curation: Sunil Kumar Agrawala, Shailly Gupta, Archana Singh.
Formal analysis: Sunil Kumar Agrawala, Shailly Gupta, Archana Singh.
Drafting - original draft: Sunil Kumar Agrawala, Shailly Gupta, Archana Singh.
Writing - proofreading and editing: Sunil Kumar Agrawala, Shailly Gupta, Archana Singh.